1. Introduction
ollowing non-melanoma skin cancer, breast cancer is the most common type of cancer among women and the second worldwide, corresponding to 25.2% of all cancers in world statistics and 29.5% in Brazil. Breast cancer is rare in men, representing less than 1% of cases (American cancer society (2019), Instituto Nacional de Cancer, Brazil, 2017).
To successfully treat and control breast cancer in the female population, it is essential to identify risk factors for the disease. Moreover, early diagnosis and immediate access to treatment are decisive conditions for the disease prognosis (American Cancer Society (2019), Instituto Nacional de Cancer, Brazil, 2017).
The histological grade of malignancy proposed by Scarff, Bloom, and Richardson and further modified by Elston and Ellis, known as the Nottingham Classification System, is considered one of the main factors for determining the prognosis of breast cancer (Beck et al., 2011, Chen et Machine learning is advantageous due to its potential to gather a large volume of information, once the appropriate accuracy and precision are achieved, on a specific disease in a single digital tool; suppressing the subjectivity of human evaluation with agility in the analysis of the material to be studied, aiming at safe and quick diagnoses, which could even be used as a "second specialized opinion" in cases of greater complexity (Wernick et al., 2010, Mulrane et al., 2008, Jones et al., 2009, Misselwitz et al., 2010).
The present study aimed to perform an automated and reproducible classification of the parameters used by pathologists to diagnose breast cancer: nuclear score, tubular score, and mitotic index. The software used for image analysis and classification (CellProfiler and Tanagra) used for the present study are free. The results obtained by the automated analysis were compared with a pathologist diagnosis (Jones et al., 2009, Carpenter et al., 2006, Lamprecht et al., 2007, Lenz et al., 2017).
2. II.
3. Materials e Methods
4. a) The samples-Inclusion and exclusion criteria
The study targeted women with breast cancer and presenting the most frequent histological types: infiltrating ductal carcinoma, invasive lobular carcinoma, and the mixed infiltrating lobular ductal form; who underwent surgical treatment for this disease in 2015 and that, until the time of surgery, had not undergone adjuvant chemotherapy or radiotherapy treatments. Complete epidemiological diagnosis and treatment data could be obtained, and histological slides were stained by the Hematoxylin & Eosin method with preserved staining, which enabled digital photographs of adequate quality.
The Santa Rita de Cássia Hospital, located in the city of Vitória, is considered the main reference hospital for cancer treatment in the Espírito Santo state, providing medical care for 625 women with breast cancer in 2015.
Out of 276 cases selected for meeting the inclusion and exclusion criteria, 52 patients were also excluded by the pathologist at the Hospital Santa Rita de Cássia due to "in situ" suffering from breast cancers. Since these issues could compromise machine learning and, consequently, the automated analysis of these images, this study included 224 cases at the end.
The year 2015 was selected because the Tumor Record Sheets for that year represents, at the beginning of the study, the most recent and complete data released by the Health Information System -Hospital Cancer Registry of the Ministry of Health of the Federal Government of Brazil.
The
5. b) Digitization of histological slides
All histological slides from the 224 selected cases were randomly reviewed by a pathologist without access to patient data at the Hospital Santa Rita de Cássia, aiming to select the samples with the bestpreserved color aspect. Twenty images of breast tissue of each selected patient were obtained using a digital camera (Moticam 1000 1.3 MPixel MTC 1000) attached to a light microscope.
6. c) Loading images to CellProfiler
Out of 4,480 digitalized photographs in the 40fold magnification, after their upload to the CellProfiler program, only the artifact-free images were maintained and recognized as adequate by this image analysis program., Therefore, 1937 images were transferred to the CellProfiler software and submitted to its algorithm, These attributes are aspects and characteristics, identified by the CellProfiler software that express the averages of the quantitative parameters of the study's objects (the images) and enabled the automated identification and classification of each object.
7. d) CellProfiler algorithm
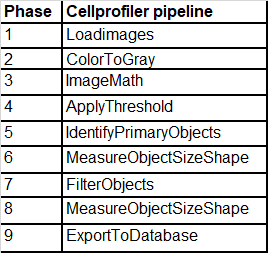
Following an algorithm developed for treating digitized images for the CellProfiler computational environment, all 1997 images were treated in the following sequence of the 9-step algorithm, as shown in Chart 1.
Chart 1: CellProfiler algorithm.
The 1937 digitized photographs treated according to this algorithm resulted in a data set exported to Tanagra cellular image data analysis software. Then, this dataset was distributed in an Excel spreadsheet (Microsoft R ), and the automated classifications of the tubular, nuclear and mitotic indexes, as well as the histological degree of malignancy, were acquired.
8. e) CellProfiler Algorithm i. Phase 1 -Load Images
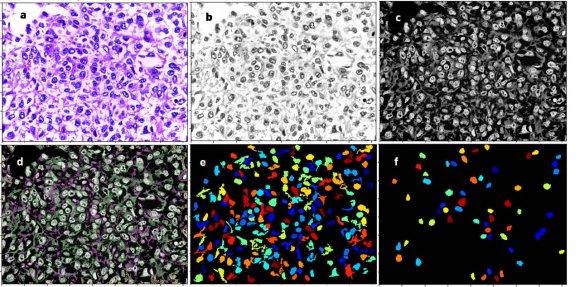
All the digitized images observed from histological slides at 40-fold magnification were transferred to the CellProfiler software (Figure 1a).
9. ii. Phase 2 -Color to Gray
The original scanned images were converted to the white/gray/black spectrum (Figure 1b).
10. iii. Phase 3 -ImageMath
Since the CellProfiler software analyzes the study's objects according to the light intensity and the cell nuclei, it was necessary to reverse the nuclei coloration initially stained in black to white and invert the other elements coloring to black (Figure 1c). generated for each digitized image with 47 quantitative parameters, called attributes.
11. iv. Phase 4 -Apply Threshold
In this stage, a binary image (i.e., an image with only two-pixel intensities, 0 and 1), was created.
12. v. Phase 5 -Identify Primary Objects
Cell nuclei were defined and identified as primary objects of the study in this step of the algorithm (Figure 1d).
13. vi. Phase 6 -Measure Objects Size and Shape
Primary objects were measured in this step, and the parameters (attributes), identified by the CellProfiler software for each study object, were acquired by the average of these measurements.
14. vii. Phase 7 -Filter Objects
An image filtering was used to suppress changes that could interfere in the primary object analysis, eliminating the artifacts and preserving only the cell nuclei (Figure 1e). After applying the image filter and eliminating artifactual changes, a new measurement of the primary objects (cell nuclei) attributes was performed.
15. ix. Phase 9 -Export to Database
After the CellProfiler algorithm steps, 47 quantitative data (attributes) for each primary object studied were identified using qualitative data from the digitized images and defined as parameters, enabling both individual identification and analysis of each primary object.
This list of attributes constituted the database exported to the Tanagra image data analysis software.
16. f) Classification after machine learning
Tanagra is open-source software for database analysis and statistical analysis developed under the design of machine learning.
In the present study, Tanagra software was used to perform the automated classification of the malignancy degree of breast cancers for the tubular, nuclear and mitotic index scores, as well as for the histological grade. Moreover, 3 parameters used in the definition of the histological grade in breast cancer were analyzed: the tubular aspect, the nuclear morphology, and the cell count in mitosis; from the analysis of the database containing 47 quantitative parameters for each analyzed object of the study.
17. III.
18. Statistical Analysis
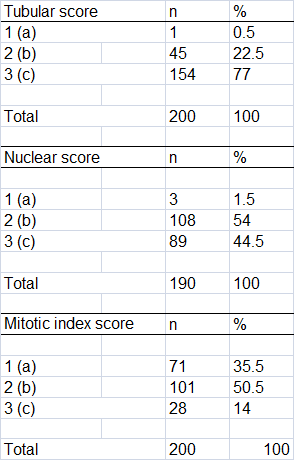
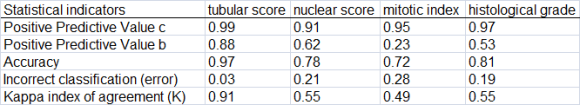
The tubular, nuclear, and mitotic index scores, which together define the histological degree of malignancy in breast cancer, were determined. The statistical parameters of Predictive Values, Accuracy, Error, and the Kappa Index of agreement between the pathologist and the medical program analyzer, were also used in this phase. The programs Tanagra and Med Calc were used for statistical processing. The statistical parameters gathered were used to determine the histological degree of malignancy.
IV.
19. Results
The present study aimed to perform an automated and reproducible classification of the pathological parameters used to diagnose breast cancer: nuclear score, tubular score, and mitotic index.
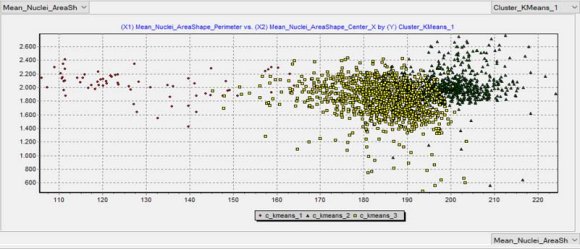
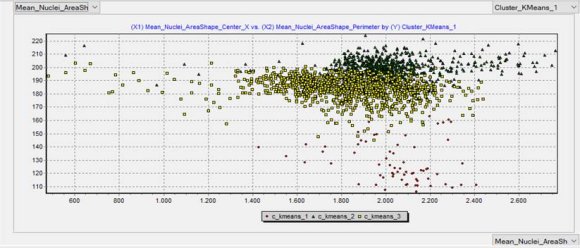
The automated classification results are depicted in Table 1, while the outcomes comparing the pathological and the automated diagnoses are shown in Table 2. A scatter plot of the automated classification resulted from machine learning is exhibited in Figure 2.
20. Discussion
Artificial Intelligence, particularly linked to machine learning, has been increasingly used as a safe and effective tool in disease diagnosis and prognosis, especially on studies assessing breast cancer, a disease of high impact on several women's lives.
This study stands out as a pioneering publication using free access software to diagnose the histological degree of malignancy in breast cancer. Thus, the automated analysis to obtain safe diagnoses of histopathological parameters is a feasible tool since a dataset with sufficient information for adequate machine learning can provide an efficient analysis that ensures remarkable accuracy.
In conclusion, digitalized images of breast cancer histological slides enabled the automated analysis of histopathological parameters, converting them into quantitative parameters for the diagnosis, and defining the histological degree of malignancy. A database expansion is necessary to optimize the analysis and provide the machine sufficient information and data, postulating solid concepts and knowledge to support all requested aspects of the analysis.
In this sense, further multidisciplinary studies covering machine learning and breast cancer in women may lead to significant novel contributions.