1. I. Introduction a) History of Nilgiris District
he Nilgiris, because of its natural charm and pleasant climate, was a place of Special attraction for the Europeans. In 1818, Mr. Whish and Kindersley, who were assistants to the Collector of Coimbatore, discovered the place Kotagiri near Rengaswamy peak. John Sullivan, the then Collector of Coimbatore was greatly interested in this part of the country. He established his residence there and reported to the Board of Revenue on 31st July 1819.
The Name 'Nilgiris' means Blue hills (Neelam -Blue and giri -Hill or Mountain) the first mention of this name has been found in the Silappadikaram. There is a belief that the people living in the plains at the foot of the hills, should have given the name, the Nilgiris, in view of the violet blossoms of 'kurinji' flower enveloping the hill ranges periodically. The earliest reference to the political history of the Nilgiris, according to W.Francis relates to the Ganga Dynasty of Mysore.
Immediately after the Nilgiris was ceded to the British in 1789, it became a part of Coimbatore district. In August 1868 the Nilgiris was separated from the Coimbatore District. James Wilkinson Breeks took over the administration of the Nilgiris as its Commissioner. In February 1882, the Nilgiris was made a district and a Collector was appointed in the place of the Commissioner. On 1st February 1882, Richard Wellesley Barlow who was the then Commissioner became the First Collector of Nilgiris.
2. b) District Administration
The Nilgiris District Comprises of six taluks, Like Udhagamandalam, Kundah, Coonoor, Kotagiri, Gudalur and Pandalur. c) The Nilgiris District: Census Data on 2011
In 2011, The Nilgiris had population of 735,394 of which male and female were 360,143 and 375,251 respectively. In 2001 census, The Nilgiris had a population of 762,141 of which males were 378,351 and remaining 383,790 were females. The Nilgiris District population constituted 1.02 percent of total Maharashtra population. In 2001. The Nilgiris District Population Growth Rate There was change of 3.51 percent in the population compared to population as per 2001. In the previous census of India 2001, The Nilgiris District recorded increase of 7.31 percent to its population compared to 1991.
3. d) Health Sector and Infrastructures
Now -a -day's health care sector playing vital role of the human society. Whether growing population and shortage of health care service providers meet the very big challenges of the growth of human society, particularly government hospitals and their quality of services have been played in very huge role in the rural part of areas.
Even though rapid growth of population and shortage of health care facilities technological aspects in government hospitals. Government hospitals have been played on essential role of human society at rural areas, and demand of health care service in government hospitals increasing to the Day -by -Day because of the certain factors like, better facilities, services and technological equipments provide to the patients. And due to the several reasons perception of government hospitals and its treatments, infrastructure available, technological equipments with the hospitals, a noble suggestions and other related studies and references.
In
4. II. Objective of the Study
? To found the standard of government hospitals that is understandable to patients. ? To identifying the facilities for the government hospital. ? To originate to the government hospitals and their quality of service and treatments.
5. a) Statement of the problems
The government hospitals have been played remarkable role in India particularly rural part of areas. As well as economically and financially low level people depends on government hospitals because of their minor and major health problem and their quality of treatment. This study reveals the major problems in government hospitals were insufficient infrastructure facilities, technological aspect medical equipments and medicines, If a response is promised in a certain time, does not happen and responding the client quickly, and quality of services.
Research Methodology: The percent study analysis and evaluation of the research questions are carried out through the primary and secondary data. Primary data collected through observation and direct interview schedule in government hospitals. The study was conducted in government hospitals and primary health care centers in Nilgiris district. The secondary data have been collected from the news papers and articles and district administration office at Nilgiris district to support the present study.
State health society, Tamil Nadu -established of 17 neonatal intensive care units ( NICUS sick neonatal care units and health and family welfare EAPII /2 Dept dated 13 / 05 / 2013., District Of The Nilgiris District Administration, Last Updated on 25-02-2012 -E-mail:collrnlg nic in Phone :0423-2442344 © District Administration The Nilgiris, Tamilnadu, India.
6. b) Limitation of the study
The period of the study is conducted to two months. And the study will be conducted to admit in different wards and out patients, and study will depend upon the accuracy of information to given by the patients.
7. c) Sample size and sampling technique
The sample size preferred for this study 50 respondent which including the general demographic profile of the respondents. And this study has to elect Non -probability sampling methods. Interview Schedule: Interpretation: The above table shown as whether the government hospitals provide quality of service 34% respondents they said yes and 66 percentages of the respondents said no. Interview Schedule: Interpretation: If is learn from the above table that 76% of the respondents have been influenced by the free medical treatment and remaining 24% of the respondents influenced by the infrastructure and quality of treatment. Interview Schedule: Interpretation: From the above table reveals that 94 percentages of the respondents replied that the quality of the government hospital in health care service good and average.
8. III. Findings and Conclusion
? Patients are satisfied with the government hospitals and the perception is responsiveness of the doctors, staff and they provide quality of service. ? Patients they may feel and expect doctors have been taken more care of the patients. ? Government hospitals and doctors also play on important role in economically and financially low level people, and especially rural part of areas like their minor and major health problem and quality of service and treatments. ? There is a problem faced by the patients in government hospitals, insufficient infrastructure facilities, technological aspect and they want that it should be quality of service and treatment. ? And the infrastructure, free treatment, cost and free medicines are influencing the patients to select a government hospital.
9. IV. Suggestion and Recommendations
Government hospitals services should be improved in terms of quality of service and treatment, and the doctors should be taken care of the patient and give them response in systematic way. The staffs, nurses and midwifes attend the patients in right time of the right place. And this study suggest government should take initiative improve the quality of the government hospitals and its infrastructure facilities. And avoiding noise pollutions and disturbance in general

| Name of the Revenue Division | Name of the Taluk | No. of Revenue Firkas | No. of Revenue Villages | Town Panchayat | Village Panchayat | |
| Coonoor | Udhagai Kundah Coonoor | 3 2 3 | 13 7 9 | Udhagai Coonoor | 4 4 | 13 6 |
| Kotagiri | 3 | 15 | Kotagiri | 1 | 11 | |
| Gudalur | Gudalur Pandalur | 2 2 | 8 4 | Gudalur | 4 | 5 |
| No of Allied pathological units available in Niligiris | ||||||||||||
| Sl No | Name of the municipalities | No of pathological units | ||||||||||
| 1 | Ooty (M) | 01 | ||||||||||
| 2 | Coonoor (M) | 01 | ||||||||||
| 3 | Udhagamandalam (B) | 01 | ||||||||||
| 4 | Coonoor (B) | 01 | ||||||||||
| 5 | Kotagiri (B) | 01 | ||||||||||
| 6 | Gudalur (B) | 01 | ||||||||||
| SNCU Sick Neonatal care units and state health | Nadu -established of 17 neonatal intensive care units | |||||||||||
| society, Tamil Nadu Published strength of Government | (NICUS sick neonatal care units and health and family | |||||||||||
| Hospital in Nilgiris District. State health society, Tamil | welfare EAPII /2 Dept dated 13 / 05 / 2013. | |||||||||||
| Year 2 015 | Sl No 1 | District Nilgiris | SNCU to be Established/ Strengthened Govt Hospital Gudular | nilgiris There are one District Head Quarters Government Hospital, 5 Taluk Hospitals, 28 Primary Health Centers, 194 Health Sub-Centre's and 5 Plague circles. And The Nilgiris District from its very inception No of staff nurses to be placed on Contract basis No of medical officer to be placed 10 21 | ||||||||
| ( D D D K D ) Volume XV Issue V Version I | Sl S.No 1 3 2 No 1 | has been a favored health resort of the Europeans and Name of the medical college hospital and No of staff nurses to be placed on Contract the officials of the Government as well. At present, the District has 194 Govt. Health Sub Centers, 28 Government. Primary Health Centers, 6 Government Hospitals, 2 Government dispensaries and one District Tuberculosis Centre. No of Government Hospitals in Nilgiris District in all Regions Name of the Hospitals in Ooty District Coonoor Wellington Govt. H.Q.Hospital Govt. Lawly Hospital Miltary Hospital Govt.Sait Hospital Sagayamatha Hospital Vijaya Hospital Nankem Hospital Kotagiri Cantonment Hospital Govt Head Quarters/ Sub (Dst) Hospitals basis as nutrition counselors Nilgiris Govt Head Quarters Hospitals Nilgiris (1) | ||||||||||
| 4 | Saraswathi Mani Hospital | Emanuel Eye Hospital | Govt. Hospital | |||||||||
| 5 | Parvathi Nursing Home | Family Plan. Asso.India | KMF Hospital | |||||||||
| 6 | Sanhita Hospital | Gudalur | Holy Family Hospital | |||||||||
| 7 | Nirmala Nursing Home | Govt. Hospital | ||||||||||
| 8 | Blisy Eye Hospital | Devershola | ||||||||||
| 9 | District TB.Centre | Garden Hospital | ||||||||||
| 10 | ESI Dispensary | |||||||||||
| Health and family welfare Hospitals, Dispensaries, Bed Strength, Doctors and Nurses | ||||||||||||
| In Nilgiris District Year -2008 to 2009 | ||||||||||||
| Indian | ||||||||||||
| Medicine | ||||||||||||
| Sl | Classification | Modern | Ayurvedic Siddha Unnani Combined Total Homeopathy | Grand | ||||||||
| No | medicine | Total | ||||||||||
| 1 | Hospitals | 26 | - | - | - | - | - | - | 26 | |||
| 2 | Dispensaries | 02 | - | 02 | - | - | 02 | 02 | 06 | |||
| 3 | Primary health center | 28 | - | - | - | - | - | - | 28 | |||
| 4 | Health sub center | 194 | - | - | - | - | - | - | 194 | |||
| 5 | Other medical | 00 | - | - | - | - | - | - | Nil | |||
| institutions | ||||||||||||
| 6 | Bed Strength | 839 | - | - | - | - | 839 | - | 839 | |||
| 7 | Number of Doctors | 74 | - | - | - | - | 74 | 01 | 75 | |||
| 8 | Number of nurses | 105 | - | - | - | - | 105 | - | 105 | |||
| Patient's Perception towards Service Quality of Government Hospitals an Empirical Study in Nilgiris | ||||||||
| District | ||||||||
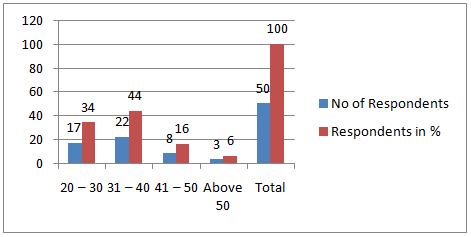
| Volume XV Issue V Version I Year 2 015 | S.No 1 2 3 4 Interpretation: Interview schedule: Age Group 20 -30 31 -40 41 -50 Above 50 Total | Respondents in Number 17 22 8 3 50 | Respondents in % 34 44 16 6 100 | 25 Volume XV Issue V Version I Year 2 015 | ||||
| D D D D ) K | D D D D ) | |||||||
| ( | ( | |||||||
| Research | ||||||||
| Medical | ||||||||
| S.No 1 | Occupation Agricultural | Simple percentage = No of Respondents _________________ * 100 Table No -III Occupation status No of Respondents Respondents in % 8 16 | Global Journal of | |||||
| 2 | Daily wages | 14 | Total No of Respondents 28 | |||||
| 3 4 | Data Analysis: Table No -I Employed in professional Business | 24 Gender of the Respondents 2 | 48 4 | |||||
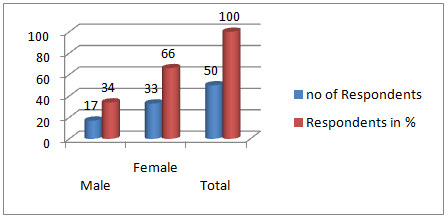
| 5 | S.No 1 | Others Tatal | GENDER Male | Respondents in Number 2 17 50 | 4 Respondents in % 34 100 | |||
| 2 Interview schedule: | Female | 33 | 66 | |||||
| Total | 50 | 100 | ||||||
| Interview schedule: | ||||||||
| Interview schedule: | |||
| Interpretation: From the above table state income level of the respondents 40% of the respondents below | |||
| 5,000, Rs.5,000 to 7,500 6%, 38 percentages of the respondents 7,500 to 10,000 and 16 percentages of the | |||
| respondents above 10,000. | |||
| Table No -V Awareness about Government Hospital | |||
| S. No | Variables | Respondents in No | Respondents in % |
| 1 | Yes | 47 | 94 |
| 2 | No | 3 | 6 |
| Total | 50 | 100 | |
| Interview schedule: | |||
| Interpretation: Table No -VII Satisfaction of services in Government Hospital | |||
| S.No | Variables | Respondents in Number | Respondents in % |
| 1 | Yes | 17 | 34 |
| 2 | No | 33 | 66 |
| Total | 50 | 100 | |
| Table No -X Preference and rating for Quality service in Government Hospital | ||||
| S.No 1 S.No 2 1 3 2 4 3 4 5 | Economic status Below 5000 Variables 5000 -7500 7500 -10000 Very high High Above 10000 Normal Total Low Very low | Respondents in Number 20 Respondents in Number 3 3 19 0 8 35 50 0 12 | Respondents in % Respondents in % 40 6 6 0 38 70 16 0 100 24 | |
| 6 | Don't know | 0 | 0 | |
| Total | 50 | 100 | ||
| Interview Schedule: Interpretation; Table No -XI Responsiveness | ||||
| S.No | Variables | Respondents in Number | Respondents in % | |
| 1 | Strongly agree | 0 | 0 | |
| 2 | Agree | 17 | 34 | |
| 3 | Neutral | 19 | 38 | |
| 4 5 Interview Schedule: Disagree Strongly disagree Total Interpretation: | 14 0 50 | 28 0 100 | Volume XV Issue V Version I | |
| D D D D ) K | ||||
| ( | ||||
| S.No | Variables | Respondents in Number | Respondents in % | |
| 1 | Accessibility | 3 | 6 | |
| 2 | Free treatment | 0 | 0 | |
| 3 | Free medicine | 35 | 70 | |
| 4 | Courtesy | 0 | 0 | |
| 5 | Credibility | 12 | 24 | |
| Total | 50 | 100 | ||
| Interview schedule: | ||||
| S.No | Variables | Respondents in Number | Respondents in % |
| 1 | Free medical treatment | 38 | 76 |
| 2 | Hospitality and infrastructure | 2 | 4 |
| 3 | Quality treatment | 5 | 10 |
| 4 | Free medical camp | 5 | 10 |
| 5 | Free ambulance facility | 0 | 0 |
| 6 | Timely attending the case | 0 | 0 |
| Total | 50 | 100 |
| Year 2 015 | ||
| S.No 1 2 3 4 5 Interview Schedule: Highly satisfied Variables Satisfied Neutral Dissatisfied Highly dissatisfied Total Interpretation: Volume XV Issue V Version I ( D D D D ) K | Respondents in Number 0 17 15 18 0 50 | Respondents in % 0 34 30 36 0 100 |
| S.No | Variables | Respondents in Number | Respondents in % |
| 1 | Excellent | 0 | 0 |
| 2 | Very good | 3 | 6 |
| 3 | Good | 18 | 36 |
| 4 | Average | 29 | 58 |
| 5 | Very poor | 0 | 0 |
| Total | 50 | 100 |
| Year 2 015 |
| K |