1. I. Introduction
urosemide drug is widely used in medicine because of it was giving as a drug diuretic given to many patients [1] furosemide chemical name is 5-(aminosulfonyl)-4-chloro-2-[(2-furanyl methyl)amino) benzoic acid ] figure (1) [2]. It has the following generic names: Frusemide, Fursemide, Aisemide, Beronald, Desdimin, Lasilix and others. The empirical formula is C 12 H 11 ClN 2 O 5 S according to the molecular weight of 330.77.Furosemide is a white to slightly yellow, odorless, almost tasteless crystalline powder, soluble slightly in water, chloroform and ether [3]. soluble in acetone, methanol, dimethyl formamide [2] and in solutions of alkali hydroxides [3]. Its melting point is about 210 C o with decomposition. .and crumble when exposed to air or light [4].The pH of the aqueous solution is in the range 8.9 to 9.3. The UV spectrum of furosemide (0.01 mg/ml) in ( 0.1N) (NaOH) was scanned Author: Chemistry Department, science College, University of kufa, Iraq. e-mails: [email protected], [email protected] from 190 to 400 nm using DMS solvent spectrophotometer it exhibited two maxima absorption at 226 and 272 nm [2]. Furosemide is a sulphonamide derivative [1]. (FRO) is using as a strongly diuretic potent associated to the thiazides but it have strong effective than thiazides [5]. The Preparations for (FRO) were injection and tablets samples [6].Methods that used to investigation (FRO) are as most depended on HPLC [7][8][9][10][11][12].However a number of spectrophotometric, they have been mentioned for furosemide too [13][14][15][16],and related drugs [17,18]. A modern procedure for the spectrophotometric investigation of (FRO) in there pharmaceuticals. by this article given a newly, rapid, sensitive and simple kinetic Spectrophotometric procedure for the investigated of trace quantities of (FRO) drug as bulk and in the Pharmaceuticals Preparations depending on the Schiff's base formation by the primary amino group found in Furosemide and aldehyde group found in the 5-sulfo salicylaldehyde reagent which acts as a ligand for the formation of intense colored complex with Co(II) in the acidic medium to form an intense colored product and the perfect circumstances were studied for this reaction. the method was applied on some different kinds of pharmaceutical Preparations with high accuracy and precision by using different doses and forms.
2. II. Materials and Methods
3. a) Apparatus
-Every absorbance and spectral estimations were performed on double -beam applied UV-Visible 160 digital recording spectrometer (japan). -Heating-cooling water bath (Haake, Fe3).
-Analytical balance (Sartorius BL 210S).
-pH meter, Jenway 3020. Abstract-A simple, rapid, sensitive, inexpensive, and easy to perform kinetic Spectrophotometric procedure for the investigation of trace quantities of the drug of Furosemide (FRO) as bluk and in the Pharmaceuticals Preparations has been improved. The method was depended on the fashioning of the Schiff's base by the reaction of aldehyde group present in the 5-sulfo salicylaldehyde reagent and the primary amino group present in Furosemide, which acts as a ligand for the formation of intense colored complex with Co(II) in the acidic medium with maximum absorption at 608nm. the Kinetic Spectrophotometric Method was by using the Fixed Time method for investigation of drug was studied. the law of Beer is applied on the range of concentration between (5 -100) ppm, the molar absorptivity and the sensitivity of Sandell were 3.9295x10 4 l.mol -1 .cm -1 , 0.008 ?g.cm -2 subsequently. the detection limit (LOD) was 2.133 µg/ml -1 . LOQ was 1.105 µg/ml -1 . The perfect circumstances for all colour improvement are portrayed and the suggested procedure has been effectively connected for the investigation of amounts of Furosemide (FRO) in bulk form and in pharmaceutical preparations (tablets, injection sample) The additives and general excipients materials did not affect in the studied method. The statistical comparison between the results that obtained from the reference method gave good agreement.
4. b) Material and reagents
The Chemicals which were used in the procedure with highly degree of purity and did not need to purification, their solutions were prepared by the following :-1-Furosemide (FRO) (500 ppm):-Pure substance was processed from the (SDI) (the company state for drug industries and medical appliances) Samara -Iraq.The The (500) ppm standard concentration solution of(FRO) was given by dissolution(0.05 gm) of a bluk substance in (100 mL) methanol as solvent in the volumetric flask . It was transferred to a dark flask and it is stable for at least one week the solution was stayed stable for more of one month The stock solution was taken Almost to perpare working concentrations.
2-Ethanolic sulphuric acid solution (2%):-It was prepared by adding(2ml) form concentrated sulphuric acid from (GCC)at percentge (%98) inl (100ml) volumetric flask, mixed well and completed the volume by Abselute ethanol from(BDH Chemicals Ltd, %99.9) .
3-5-sulfo salicylaldehyde (5SSA)(0.01) M:-The reagent was given from (BDH) Chemicals Ltd, reagent Laboratory) company by dissolution (0.202) gm of pure material in (100 ml) methanol as solvent by (BDH Chemicals Ltd,%99.9). 4-Cobalt chloride CoCl 2 .6H 2 O (0.003) M:it was supplied from (BDH) Chemicals Ltd, reagent Laboratory) company given by dissolution 0.071 g in 100 mL of deionzed water. c) Suggested Procedure [19 ] In a progression of flasks of (25ml), equal volumes of the solutions standard with concentrations of (10 -100) ppm, individually in conclusive volume were included independently, taken after with the addition of (5ml) from the Reagent (5SSA) (0.01M), and complete the volumes to (15ml) by Ethanolic sulphuric acid solution and ,now heating and mixing well in boiling water bath at room temperature for (50) min, for the formation the Schiff base then we leave the solutions for ten minutes for cooling, the absorbance was obtained at (360nm), individually against ethanol solvent as blank, (1.5) mL of Co(II)solution was added and complete the volumes by using ethanol. The absorbance of the complex green colour was obtained at( 608) nm against blank reagent, After(10) min, The quantity of (FRO) found in the samples was examined from the calibration curve. d) Assay Procedure for Furosemide (FRO) in Pharmaceutical Preparations.
A number of preparations giving the Furosemide (FRO) as ingredient active were gotten and it incorporated the next table :- Table (1 Five tablets were taken and weighing, soft powdered from every kind of tablets independently, precisely measured the powder segment for identical to (0.05)gm of (FRO) that relies on upon the kind of tablets which be utilized, dissolvable after that sifting to particular the non-disintegrated segments. At that point moved into a (100ml) flask calibrated and weakened to the last volume by methanol solvent. Taken after take the reasonable measure of every record arrangement and treated in the same conditions that were utilized as a part of the based procedure for making was to discover a concentration relying on a calibration curve. e) Injection Procedure [1] (5ml) ampoule which have (0.05 gm) of (FRO) was moved into 100 ml flasks volumetric and weakened up to the imprint with methanol solvent. At that point we computed the concentration by using the calibration curve.
5. III. Results and Discussion
a) The perfect circumstances were studies for reaction Various circumstances were contemplated that are influencing on the absorbance for the result compound that lead to increase it. b) Effect of (5SSA) Reagent Concentration [20] To study the reagent effect of (5SSA) concentration on the absorbance. It was making by utilizing (2) ml of (500) ppm Furosemide (FRO) drug were transferred into a sequence of 25 mL volumetric flasks, varying volumes for (5SSA)(0.01) M from (0.5 -8)ml was taking and complete the volumes to (15ml) by Ethanolic sulphuric acid solution and. heating and mixing well in boiling water bath temperature for (50) min, for the formation the Schiff [19] The results were appear that the nearness of acid was making expanding in the highly absorbance for the result product, in this manner a few acids, for example HCl, CH 3 COOH, H 2 SO 4 and HNO 3 are inspected at (2%) as concentration they were gave that every one of the studied acids obtained the absorbance of colour product, sulphuric acid was the best acid that obtains the largely absorption which chose in the accompanying experiments. which was used as Ethanolic sulphuric acid solution,that used for dilution all solutions for drug. d) Effect of Cobalt chloride concentration [21] The effect of different volumes (0.1-3 mL) of Cobalt chloride (0.003M) on the formation of the complex was also studied (Figure (3). It was observed an expansion in the absorbance of complex formed up to 1.5 mL it was remaining constant in bigger volumes. Therefore, 1.5 mL of 0.003M Co(II)solution was used for the determination of drug, since it gives high sensitivity and minimum reagent blank. .
6. Figure (3) :
The volume Effect of cobalt choride (0.003M) e) Effect of Temperature [19] The temperature effect was examined for the range of (20-120) ºC It was found that the color intensity expanded with temperature increasing up to 25 ºC, and it was slightly increased at higher temperatures.
The highest absorbance was at 100 ºC, the next experiments were performed by boiling water bath at the temperature of room that need to Schiff base formation to simplify the analytical procedure. f) Effect of order addition [20] Different orders of addition of the reagents had been done. The results table (3) After heating and mixing well in boiling water bath at room temperature for drug and reagent It was found (50) minutes that the best time for completing the Schiff base reaction which selected in subsequent experiments. h) Reaction Time Effect [23] The intensity colour for the product was shown on the maximum after the drug (FRO) had been responded with the Schiff base, and Co(II)solution and got stabilized after 10 minutes. In this manner ten minutes advancement time was chosen as ideal in the suggested procedure. The resulted colour was stabilized at over than 24 hour.
7. i) Absorption Spectra
The spectral scan was directed to get the more absorption wavelength of coming about the Schiff base compound subsequent to introducing the perfect circumstances for this reaction.a gainst blank solution (ethanol solvent), after that, The spectral scan was obtained the greater wavelength absorption for the colour complex which was resulting from the reaction between the Schiff base and Co(II)solution.
Figure (4) shows the spectra of colour complex formed by the reaction between the Schiff base and Co(II)solution .against blank (Schiff base solution), the absorption was maximum at 608 nm where (A) spectrum gives the colour for complex resulting by the reaction, (B) is obtaining the spectrum of blank (Schiff base solution). (C) spectrum represents the spectrum for pure drug (FRO). The Fixed Time Kinetic Spectrophotometric procedure for investegation of drug was studied In this procedure, the absorbance for the reaction solutions which have different quantities of (FRO) drug were calculated at a pre-chose fixed time at intervals of 2 min. The absorbance between the times t 1 (2 min) and t 2 (4, 6, 8, 10, 12, 14, 16 and 18 min) was recorded and plotted against the concentration of drug The corresponding linear regression equations with values of r 2 are summarized in Table (4). Plainly t the slope expands by the time, the most satisfactory values of r 2 and the intercept were gotten for an altered time of(10) min for the (FRO) which was therefore selected as the more accepted time interval for the estimation and demonstrated wider concentration ranges for quantification. for this reason, on the foundation of expanding concentration range and the analysis less time. Utilizing the circumstances depicted in the strategy, a calibration curve was linear for Furosemide (FRO) is acquired (Figure 3), that appears that law of Beer is obeyed into the range of concentration between (5 -100) ppm, the other Spectral and Statistical information for the investigation of (FRO) by the purposed procedure were summarized at Table (5). 3.9295 x10 4 The law of Beer limits (?g/ml)
8. Volume XVI Issue II Version I
(5 -100) the sensitivity of Sandell (?g.cm -2 ) 0.008 Intercept (a) 0.071 The detection Limit (LOD) (µg/ml -1 )
1.105 The quantification Limit (LOQ) (µg/ml -1 )
9. k) Precision and Accuracy
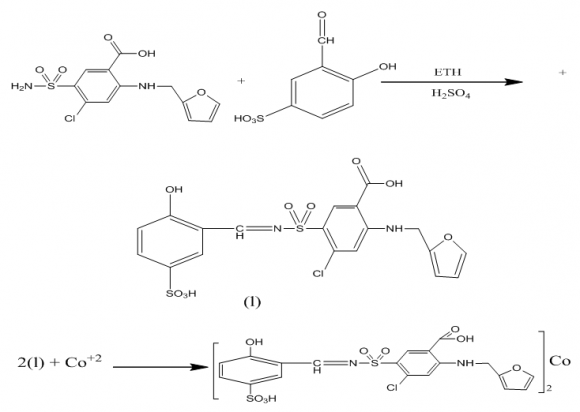
The precision and accuracy for the studied kinetic Spectrophotometric procedure were investigated at three various concentrations from furosemide (FRO) drug breaking down five repeat tests of every concentration by the proposed method. percentage relative error (E%) as accuracy and Percentage relative standard deviation (RSD%) as precision for the proposed procedure were computed. The results in Table (6) depict good accuracy and precision as illustrated by the low values of RSD%. and low values of E%, proving the repeatability and reproducibility of theproposed method. (All the results were calculated for five determinations). The Schiff base formation was apparent from the literatures, that a mole ratio between (FRO) drug and (5SSA) was (1:1) that leading to form a new ligand having low absorbance. The absorbance sensitivity has been increased by its reaction with Co(II) to give an intense colored complexes. The stoicheiometry of the reaction of (FRO) drug with (5SSA) and Co(II) was performed by mole ratio method and Job's method. The methods applied by using (1×10 -3 )M solution of each of the drug, the reagent and Co(II) salt to determine the stoicheiometry of complex product .The absorbance of the solutions were measured at maximum wave length (608 nm) colour product. from these methods (figure 4) the results are showing that 2:1 new ligand (Drug with (5SSA): Co(II) complex was formed at 608nm. The product formed was ethanol soluble, A reaction mechanism based on the above reaction is shown in Scheme fig (5) [24][25][26]. The stability constant for the product complex was figured by looking and measuring the absorbance of a solution which including stoicheiometric measure of new ligand (Drug with (5SSA)and Co(II) with that of solution which was having the perfect quantity (1ml of 2×10 -3 M).and utilizing the solution of Co(II) ion at five times concentration from the initial concentration. The average for calculated stability constant for the colour result in ethanol under the characterized experimental circumstances was 2.38×10 6 l 2 .mol -2 Effect of solvent [32]:-The type of solvent that was dissolving the drug substance employed affects both the wavelength and intensity of maximum absorption. Table (2) shows the effect solvent, methanol was the best solvent, which giving very high intensity of maximum absorption which was in the case of using (5SSA) as the aromatic aldehyde. methanol is appeared to be a decent solvent from the point perspective of economy and sensitivity. (Solvent utilized for the dilution to the mark of (25ml) conical flask).
( D D D D ) B m) InterferencesThe Specificity of the suggested kinetic spectrophotometric procedure (fixed time procedure) for investigation of the (FRO) drugs within the sight of Often experienced excipients like, talc, lactose, Acacia, starch, Glucose Sucrose, polyvinylpirrolidone (PVP), magnesium stearate, and aspartate. by the presented study, solution of (FRO) was framed and everyone from the studied excipients was given independently by tentimes concentrations more than of (FRO) were prepared by the self procedure in the Calibration curve. (2 ml) of (100)ppm (FRO) and (2ml) of every excipients was connected for the study of interferences after that dilution to the sign of volumetric flask (25ml). grade of impedance was believed to make the procedure more satisfactory if the mistake was not more than ± 2% in respect to the normal No obstructions were seen on the investigation of (FRO) within a sight of the studied excipients (Three determinations Average) Table (7) Table (7) The procedure was applied for the assay of pharmaceutical preparations of the drug, was studied. The consequence of examine for accessible formulations of Furosemide (FRO) drugs are appeared by following Table (8). Wherever the three normal determinations. also, the standard strategy were gotten from (2009)British Pharmacopeia. The outcomes were Replicable and the determination procedure of formulations was through examined by the Standard procedure
10. IV. Conclusion
The present spectrophotometric procedure was A rapid, easily, sensitive and precise procedure has been created for the investigation of trace quantities of Furosemide (FRO) and relevant for the investigation of (FRO) in tablets and injection, The proposed procedures are free from basic exploratory conditions and muddled systems, for example, extraction step. The reagents utilized as a part of the procedures are shabby, promptly accessible and the methods don't include any dreary sample preparation. These points of interest empower the utilization of the presented techniques in quality routine control investigation of Furosemide (FRO) in pharmaceutical preparations.

![company (U.K) Per tablet 40 mg furosemide Furosemide Tablets(5) Sanofi-Aventis Deutschland, Sanofi Winthorp Industrie company ( France)Per tablet: 40 mg furosemide Lasix, furosemide tablets(5) Bristol Laboratories, Berkhamsted, Herts company (U.K) Per tablet 40 mg furosemide Furosemide Tablets BP(5) Sanofi-aventis Guildford, Surrey, company (U.K) Per 2 mL: ampoule 20 mg furosemide Furosemide bosi injection 1-Tablets Procedure[4]](https://medicalresearchjournal.org/index.php/GJMR/article/download/1102/version/100638/3-Kinetic-Spectrophotometric-Procedure_html/10814/image-4.png)
| Table (2) : Effect of addition order | ||
| No. Order of addition | Abs. | |
| 1 | D+R+A+M | 0.788 |
| 2 | R+M+D+A | 0.566 |
| 3 | M+D+A+R | 0.493 |
| 4 | A+R+M+D | 0.202 |
| g) Effect of the time for completing the Schiff base | ||
| reaction [22] | ||
| intervals using fixed time procedure | |||
| Reaction time (min) | Linear range(ppm) | Regression equation | r 2 |
| 2 | 12 -50 | y= 0.0076 x + 0.321 | 0.9912 |
| 4 | 10 -50 | y= 0.0105 x + 0.211 | 0.9933 |
| 6 | 10 -60 | y= 0.1154 x + 0.123 | 0.9943 |
| 8 | 5 -80 | y= 0.1179 x + 0.093 | 0.9986 |
| 10 | 5 -100 | y= 0.1188 x + 0.071 | 0.9994 |
| 12 | 5 -100 | y= 0.1191x + 0.128 | 0.9989 |
| 14 | 5 -90 | y= 0.1173x + 0.099 | 0.9980 |
| 16 | 5 -70 | y= 0.1145 x + 0.137 | 0.9977 |
| 18 | 5 -60 | y= 0.1112 x + 0.154 | 0.9969 |
| Year 2016 | |||
| D D D D ) | |||
| ( B | |||
| y = 0.1188x + 0.071 | ||||
| R² = 0.9994 | ||||
| 0.2 | ||||
| 0 | ||||
| Conc. Of (FRO) ppm present | Conc. Of (FRO) ppm Found | % Error | % Recovery | % R.S.D |
| 10.00 | 9.85 | -1.50 | 98.50 | 0.89 |
| 40.00 | 39.88 | -0.30 | 99.70 | 0.56 |
| 80.00 | 80.15 | 0.18 | 100.18 | 0.21 |
| Year 2016 | ||
| Volume XVI Issue II Version I | ||
| Acetone | 580 | 3.176 × 10 3 |
| chloroform | 530 | 1.3368 x10 3 |
| 2-propanol | 436 | 8.4271 x10 2 |
| Acetic acid | 345 | 1.8710 x10 2 |
| Dimethyl sulphoxide | 570 | 2.9010 x10 2 |
| CCl 4 | 510 | Two layers |
| Dioxine | 480 | Two layers |
| Dimethyl formamide | 510 | 1.0320 x10 3 |
| Ethanol | 560 | 6.1010 x10 3 |
| Benzene | 530 | 2.3210 x10 2 |
| Methanol | 608 | 3.9295 x10 4 |
| Teri butyl alcohol | 555 | Two layers |
| Formic acid | 430 | 2.8733 x10 2 |
| Pyridine | 360 | Turbid |
| Di ethyl ethe | 420 | 1.8761 x10 2 |
| Pharmaceutical preparations including (FRO) | Average recovery % | |
| Proposed procedure | Standard | |
| procedure (4) | ||
| Pure (FRO) | 98.410 | 98.230 |
| Furosemide tablets (40) mg (FRO) | 100.360 | 99.660 |
| Lasix , furosemide tablets (40)mg (FRO) | 100.420 | 100.170 |
| Furosemide tablets BP (40) mg (FRO) | 101.220 | 99.450 |
| Furosemide bosi injection (20) mg (FRO) | 98.860 | 98.340 |