1.
people die from stroke which is equal to 1 in every 20 deaths 3 . 87% of the stroke are due to ischemia and the rest 13% are due to hemorrhage 4 . The death due to stroke annually in United States is 130000 which is equal to 1 in every 20. Hypertension is the most important risk factor for stroke 5 . Hemorrhagic stroke has higher morbidity and mortality when compared to ischemic stroke. Hemorrhagic stroke is due to bleeding either in the brain or in the subarachnoid space 6 . Identifying high risk patients for development of Intracerebral Hemorrhage and to institute vigorous treatment in these patients is vital for prevention of Intracerebral Hemorrhage. Factors such as age, the score on Glasgow coma scale, the size of hematoma, rupture of hemorrhage in ventricle, midline shift and pulse pressure have been identified as determinant of outcome. The clinical and the CT correlates may contribute to the ultimate prognosis of these patients. By studying prognostic parameters of hypertensive Intracerebral Hemorrhage we can identify high risk patients, who are prone to develop Intracerebral Hemorrhage. Therefore, we can offer prompt and right treatment to patients with Intracerebral Hemorrhage.
2. II. Objectives
1. To study the prognosis of patients with hypertensive intracerebral hemorrhage clinically. 2. To study prognosis of patients of hypertensive intracerebral hemorrhage with help of CT scan brain.
3. III. Materials and Methods
This is a prospective observational study with 65 patients. Follow up was done after one month of the patients included in the study. All CT proven hypertensive intracerebral haemorrhage patients admitted included in study with systolic BP >140mm of Hg and diastolic BP >90 mm of Hg. Patients having haemorrhage as a result of head injury, bleed in primary or secondary brain tumours, haemorrhage within a cerebral infarct, bleeding secondary to arteriovenous malformation and aneurysms were excluded. A thorough General examination was undertaken in particular for Glasgow coma scale, Vital examination I. Introduction erebrovascular accident or stroke is defined as an acute loss of focal and at times global (applied to patient in deep coma and those with subarachnoid hemorrhage) cerebral function, the symptoms lasting more than 24 hours or leading to death with no apparent cause other than that of vascular origin(WHO). Stroke can be ischemic or hemorrhagic and this is due to lack of blood flow to the brain and bleeding in the brain tissue respectively. Stroke can manifest with symptoms like loss of sensory or motor functions on one side of the body. It can also manifest as loss of vision, inability to speak or understand 1,2 In CT scan a preliminary lateral topogram of the cranium was obtained. Serial transaxial scans were then performed with OM line as reference and employing 10mm and 5 mm sections. 5/5 mm sections were performed through posterior fossa. CT Head was carried out to know the site, size, volume, mass effect, ventricular extension, cerebral edema of intracerebral hemorrhage. All data was analysed using appropriate statistical tests. A p value of <.05 will be considered significant. Data was entered in excel sheet and analyzed by EPI INFO software. Two thirds of the stroke are in patients with age greater than 65 7 . In our study, there were 45 patients with age > 60 which is 69.23%. Maximum patients presented with altered sensorium (61.5%). Headache was present in 47.69% patients and vomiting was present in 47.69%. Hemiplegia was present in 46.1% patients.
4. IV. Result and Analysis
In our study 40 (61.5%) patients were known case of hypertension, in which 22 (55%) patients expired. Our study is showing higher mortality (76%) in first time diagnosed hypertensive patients than in patients who were known case of hypertension.
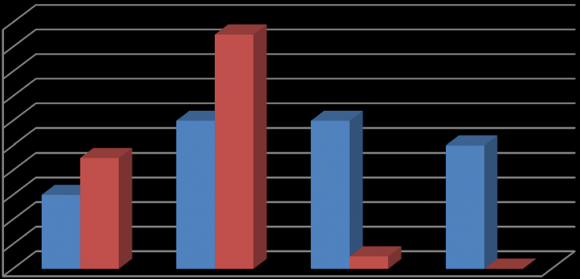
In our study 14 (21.5%) patients were known case of Diabetes in which 12 (85.7%) patients expired. So higher mortality was seen in patients with Diabetes Mellitus (85.7%) than in patients without Diabetes (56.8%). In our study 37(56.9%) were smokers and higher mortality (70.2%) was seen amongst smokers than nonsmokers(53.6%). In our study maximum patients were in GC score 14-15 (53.3%). GC Score 3-4, 5-8, 9-13 had 100%, 90.9%, 100% mortality respectively, but GC Score 14-15 had only 8.5% mortality. This shows that prognosis (mortality) is worse with lower GC Score (p value = 0.002). This is statistically significant.
Single site of hemorrhage:
? Cerebral cortex ? Thalamus ? Internal capsule ? Putamen ? Basal ganglion ? Cerebellum 5 2 - - 243-4 5-8 9-13 14-15 2(40%) 1(50%) In our study patients with single site hemorrhage were 13(20%) with 46.2% mortality, 46.6% with GC score of 14-15 at the time of presentation. With three sites of hemorrhage 69.2 % patients were in GC score 3-4 and 92.3 % patients expired. With > 3 sites there was 100% mortality. So in our study with increasing sites of hemorrhage there is decreasing GC score at presentation with increasing mortality trend (p value= 0.07). Here, as p value is >0.05, this is not statistically significant. But as per some studies, brain stem hematoma, intraventricular extension of bleed and ventricular compression along and with midline shift are associated with early mortality in intracranial hemorrhage 8 . V. Discussion
1(50%) 2(50%) - - - - - 1 2 1 - - - 2 - - - - - -35. Site of
In our study maximum no. of patients had hematoma volume >10,000 mm3 -30(46.15%) followed by 21 (32.3%) patients with volume <2500 mm3 .Mortality is rising with increasing volume of hemorrhage in the study. There was 100% mortality with hematoma volume >7500mm3. P value was 0.0001 and this shows that the result was statistically significant. As per some studies, when the size of hematoma is >30 cm 3 , the morbidity and mortality increases significantly 8 .
As per age distribution, in our study, 100% mortality was noted in age group 70-79 yrs., 80-89 yrs. and >90 yrs. In our study for sex distribution, out of 65 patients, 55.3 % were males and 44.6% were females. Thus the ratio of male to female was 1.2:1. There was no significant association was found in male and female sex and poor outcome. (p value-0.497). For history of hypertension, in our study 61.5% were known case of hypertension, out of them 55% patients expired. Rest 38.4% patients were freshly detected cases of hypertension. Our hospital gets patients from lower socioeconomic strata with poor education. Our history for Diabetes Mellitus shows out of 65 patients, 21.5% patients had H/O diabetes, out of which 85.7 % expired. The GC score established significant correlation between the Glasgow coma scale on admission and poor outcome. (p=0.002). In our study for site of hematoma, high mortality was not significantly associated with No. of sites of hemorrhage (p=0.07). However, the increasing No. of hemorrhages is associated with increasing mortality. Most patients had multiple sites of hemorrhage at the time of presentation. Therefore, prognosis on the basis of site (basal ganglia, thalamus, lobar, brain stem, cerebellar) was not possible. The volume of hemorrhage study shows the volume of intracerebral hemorrhage >10,000 mm3 is considered a severe stroke and proven as poor prognostic parameter for 30 days' mortality outcome. (p value =0.0001).
6. VI. Conclusion
Glasgow coma scale on admission is significant for poor prognosis. Number of sites of hemorrhage in a CT scan is not significant with poor outcome. The volume of the hemorrhage is significant for poor outcome of stroke.
| including temperature, pulse, respiratory rate, and blood | |||||
| pressure was noted, Peripheral signs of atherosclerosis | |||||
| like arcus senillis, locomotor, brachialis, thickened | |||||
| vessel | wall, | vascular | bruit, | xanthomas | and |
| xanthelesmas. | |||||
| Year 2016 | |||||
| Volume XVI Issue II Version I | |||||
| D D D D ) | |||||
| ( A | |||||
| . | |||||
| Cerebrovascular accidents represent third commonest | |||||
| cause of death worldwide. In United States, every year | |||||
| around 795000 people suffer from stroke and 130000 | |||||
| 2 : Distribution According To Presenting | |||
| Symptoms | |||
| Symptoms | No.of cases Percentage | ||
| Weakness of limb | |||
| - | Hemiplegia | 41 | 46.15% |
| - | single limb | 2 | 3.0% |
| Altered sensorium | 40 | 61.5% | |
| Headache | 31 | 47.69% | |
| Vomiting | 31 | 47.69% | |
| Convulsion | 7 | 10.76% | |
| Sensory symptoms | - | - | |
| Vertigo | 2 | 3.0% | |
| Aphasia | 1 | 1.5% | |
| Table-4: | |||||
| GC Score | Total Cases | Survived (%) | Expired (%) | P value | |
| 3-4 | 15(23.1%) | - | 15 (100%) | ||
| 5-8 | 22(33.8%) | 2(9.1%) | 20 (90.90%) | ||
| 9-13 | 4(6.1%) | - | 4 (100%) | 0.002 | |
| 14-15 | 24(36.9%) | 22(91.7%) | 2 (8.3%) | ||
| TOTAL | 65 | 24(36.9%) | 41 (63.1%) | ||
| 30 | |||||
| 20 | |||||
| EXPIRED | |||||
| 10 | SURVIVED | ||||
| 0 | |||||
| (3-4) | (5-8) | (9-13) | (14-15) | ||