knowledge sharing within professional groups, like physicians in hospital. Knowledge
sharing would be alarming if knowledge sharing is not done in hospitals were we deal
with human lives. This study examines the factors affecting physician's knowledge
sharing behavior within a hospital department by existing theories, the theory of
reasoned action (TRA) and the theory of planned behavior (TPB). Here we have a slight
differentiation, we compare TPB model to a model were Attitude is further sub divided
depending upon age, gender, departments and hospital ownership status. Their theoretical
and practical knowledge is vital to the care of patients, and the quality of specialty-based
clinical practices is a major determinant for patients' use of medical services. Knowledge
sharing in this sense becomes all the more important for physicians in tertiary hospitals,
because they are required to be researchoriented, creative in medical care, and ready
to take new medical knowledge opportunities that can be acquired through various organizational
learning mechanisms (OLMs) (Lipshitz & Popper, 2000). The ultimate objective of physicians' knowledge sharing is to elevate the quality
and efficiency of care in hospitals. We consider Rayen Dental Care Centre. (RDCC)
as the platform for
2. II. Introduction a) About Rayen Dental Care Centre (RDCC)
"We speak from our heart and not from our tongue when we explain the problem to the
patient because ultimately truth prevails in the long run. We work on the above said
principles and all our patients work are preferably appointment based.
Rayen's Dental centre located in the central zone (Heart) of Chennai is well known
for its hygienic, outstanding, exceptional quality dental practice providing the latest
updated scientific data pertaining to all specialities in dentistry. Apart from providing
health service we are ignited with a passionate heart to handle our clients with utmost
kindness. We provide a comfortable environment with subtle differences in every aspect
of dental practice to provide quality care and that earmarks our difference from others".
Here we have taken the social responsibility factor to be present hence there is no
bias as we compare with both before and after the survey (i.e. awareness). H1: The
after survey (awareness) is higher. H2: The before survey (awareness) is higher.
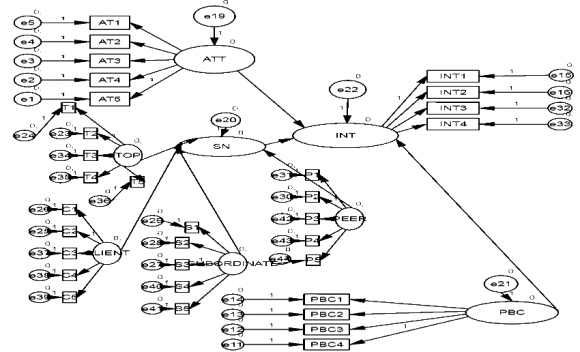
Here in this study we use theory of planned behaviour of Ajzen, further to which we
have applied the concept of Human resources as Subjective Norms can be further classified
as:
3. IV. Sample and Data Collection
A total of 500 questionnaires were administered out of which 400 was answered.
The questionnaires had a cover letter briefing about the aim of this study. The same
were administered both before and after the surveyconsidered as awareness created.
4. V. Measurement Development
The measures used in the research model were mainly adopted from some of the precedent
related studies with minor statement changes, adapting to the college faculty knowledge
sharing context. In order to increase the accuracy of measurement, a multi-item method
was used and each item was based on a five point Likert scale. Such as, the items
were measured on a 5-point Likert scale; ranging from The maximum percent weightage
falls on 3 rd question and minimum percent is in the first question. The maximum
percent weightage falls on 3 rd question and minimum percent is in the first question.
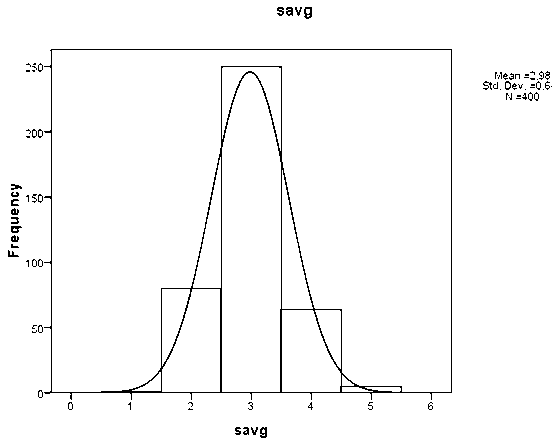
The average shows that the 3 rd and 4 th i.e. 3.5 element has more frequency which
means that faculty are ready to share knowledge in the Top Management.
The maximum percent weightage falls on 3 rd question and minimum percent is in the
first question. The maximum percent weightage falls on 3 rd question and minimum
percent is in the first question.
5. Medical Research
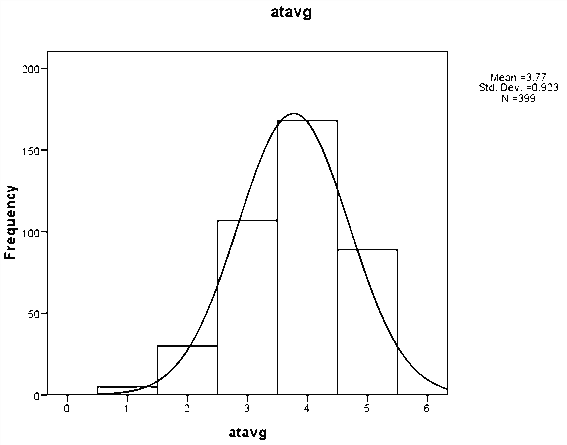
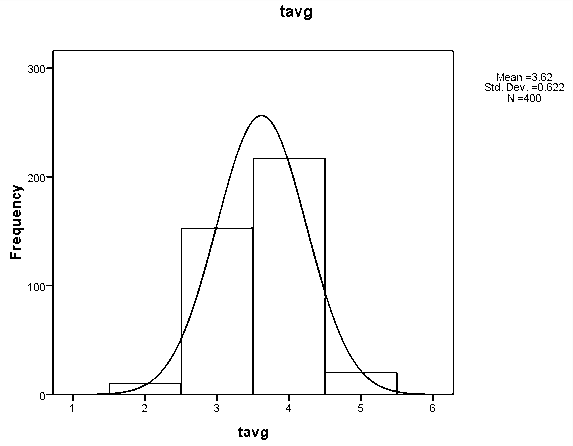
Volume XVIII Issue I Version I The Attitude average shows that the 4 th element has
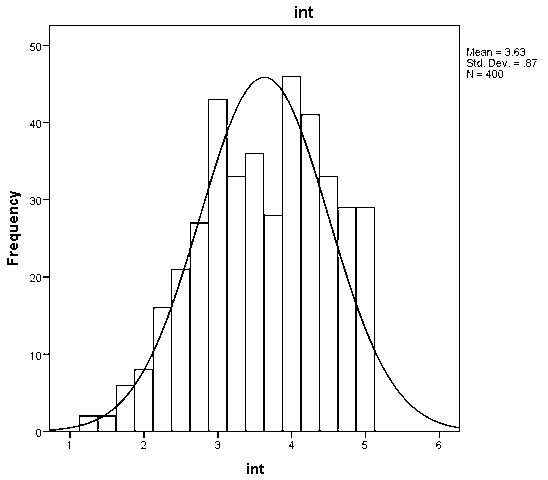
more frequency which means that it is very valuable to share knowledge. The Intention
average shows that the 4 th element has more frequency which means that it is very
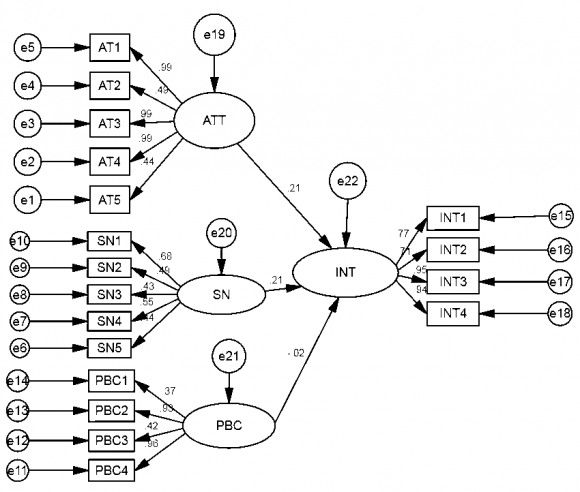
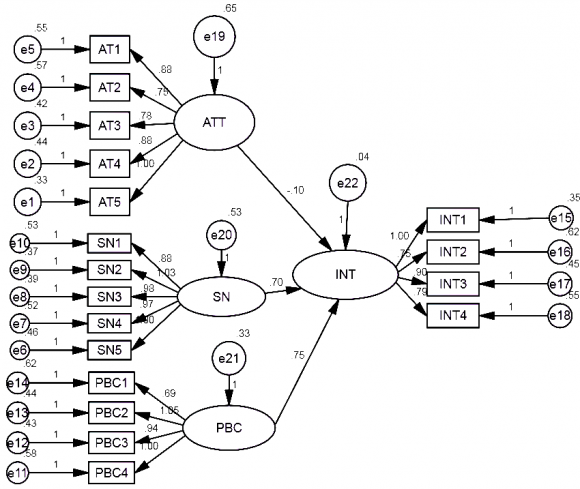
valuable to share knowledge. The path coefficients were tested for significance level
of 0.01.
6. VI. Path Coefficients and Conclusions
The path coefficients from attitude to intention and subjective norms to behavioral
intention were noteworthy for all the models. After model seems to be more convincing
thus the analysis is proved.
Note: KKnowledge Sharing Behavior of Physicians (Dentists) in Hospitals
Figure 13. Table 2 :2
Model
NFI Delta1
RFI rho1
IFI Delta 2
TLI rho 2
CFI
Default model
.859
.818
.874
.836
.873
Figure 14. Table 3 :3
Model
PRATIO
PNFI
PCFI
Default model
.772
.663
.674
Table 4: NCP
Model
NCP
LO 90
HI 90
Default model
1010.399
906.154
1122.091
Table 5: FMIN
Model
FMIN
F0
LO 90
HI 90
Default model
2.147
1.899
1.703
2.109
Table 6: RMSEA
Model
RMSEA
LO 90
HI 90
PCLOSE
Default model
.120
.114
.126
.000
Note: KKnowledge Sharing Behavior of Physicians (Dentists) in Hospitals
Figure 15. Table 1 :1
Test Value = 0
t
Df
Sig. (2-tailed)
Mean Difference
95% Confidence Interval of the Difference
Lower
Upper
AT1
72.852
399
.000
3.898
3.79
4.00
AT2
79.359
399
.000
4.100
4.00
4.20
AT3
70.286
399
.000
3.992
3.88
4.10
AT4
64.473
399
.000
3.900
3.78
4.02
AT5
39.608
399
.000
2.760
2.62
2.90
S1
44.594
399
.000
3.388
3.24
3.54
S2
39.104
399
.000
2.775
2.64
2.91
S3
42.788
399
.000
3.110
2.97
3.25
S4
91.292
399
.000
3.712
3.63
3.79
S5
102.873 399
.000
3.778
3.71
3.85
T1
53.374
399
.000
3.185
3.07
3.30
T2
58.575
399
.000
3.780
3.65
3.91
T3
64.428
399
.000
3.545
3.44
3.65
T4
55.503
399
.000
3.115
3.00
3.23
T5
124.078 399
.000
4.625
4.55
4.70
C1
63.318
399
.000
3.855
3.74
3.97
C2
57.274
399
.000
3.708
3.58
3.83
C3
30.557
399
.000
1.850
1.73
1.97
C4
44.951
399
.000
2.028
1.94
2.12
C5
91.292
399
.000
3.712
3.63
3.79
P1
52.667
399
.000
3.172
3.05
3.29
P2
52.320
399
.000
3.175
3.06
3.29
P3
94.360
399
.000
3.920
3.84
4.00
P4
92.636
399
.000
3.885
3.80
3.97
P5
91.211
399
.000
3.832
3.75
3.92
PBC1 51.186
399
.000
3.172
3.05
3.29
PBC2 41.646
399
.000
2.668
2.54
2.79
PBC3 96.514
399
.000
4.202
4.12
4.29
PBC4 95.847
399
.000
4.205
4.12
4.29
INT1
68.371
399
.000
3.472
3.37
3.57
INT2
71.904
399
.000
3.480
3.38
3.58
INT3
63.318
399
.000
3.855
3.74
3.97
INT4
57.274
399
.000
3.708
3.58
3.83
Figure 16. Table 3 :3
Figure 17. Table 2 :2
Frequency
Percent
Valid Percent
Cumulative Percent
1
1
.2
.2
.2
2
80
20.0
20.0
20.2
Valid
3 4
250 64
62.5 16.0
62.5 16.0
82.8 98.8
5
5
1.2
1.2
100.0
Total
400
100.0
100.0
Note: KKnowledge Sharing Behavior of Physicians (Dentists) in Hospitals
Figure 18. Table 4 :4
Frequency Percent
Valid Percent
Cumulative Percent
.00
80
20.0
20.0
20.0
1.40
1
.3
.3
20.3
1.60
1
.3
.3
20.5
1.80
11
2.8
2.8
23.3
2.00
6
1.5
1.5
24.8
2.20
19
4.8
4.8
29.5
2.40
26
6.5
6.5
36.0
2.60
28
7.0
7.0
43.0
2.80
29
7.2
7.2
50.2
Valid
3.00 3.20
46 39
11.5 9.8
11.5 9.8
61.8 71.5
3.40
59
14.8
14.8
86.3
3.60
13
3.3
3.3
89.5
3.80
11
2.8
2.8
92.3
4.00
10
2.5
2.5
94.8
4.20
11
2.8
2.8
97.5
4.40
5
1.3
1.3
98.8
4.60
3
.8
.8
99.5
4.80
2
.5
.5
100.0
Total
400
100.0
100.0
Note: KKnowledge Sharing Behavior of Physicians (Dentists) in Hospitals
Figure 19. Table 5 :5
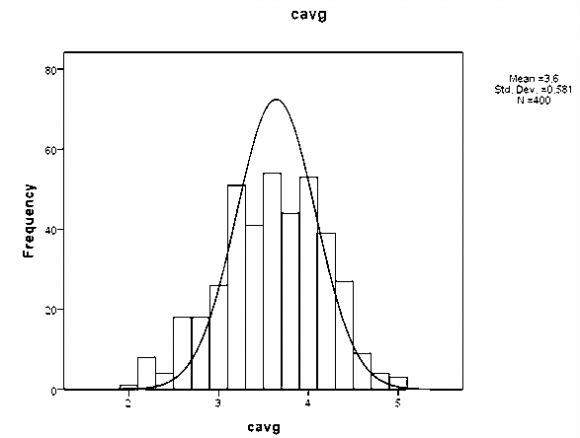
Cavg
Frequency Percent
Valid Percent
Cumulative Percent
.00
80
20.0
20.0
20.0
2.00
1
.3
.3
20.3
2.20
6
1.5
1.5
21.8
2.40
4
1.0
1.0
22.8
2.60
16
4.0
4.0
26.8
2.80
14
3.5
3.5
30.3
3.00
21
5.3
5.3
35.5
3.20
42
10.5
10.5
46.0
Valid
3.40 3.60
33 42
8.3 10.5
8.3 10.5
54.3 64.8
3.80
35
8.8
8.8
73.5
4.00
41
10.3
10.3
83.8
4.20
32
8.0
8.0
91.8
4.40
22
5.5
5.5
97.3
4.60
6
1.5
1.5
98.8
4.80
3
.8
.8
99.5
5.00
2
.5
.5
100.0
Total
400
100.0
100.0
Figure 20. Table 6 :6
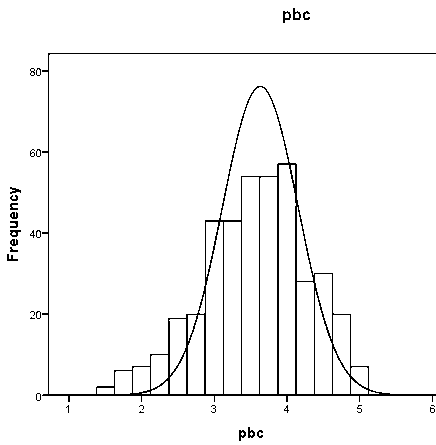
Pbcavg
Frequency
Percent
Valid Percent
Cumulative Percent
.00
80
20.0
20.0
20.0
1.50
2
.5
.5
20.5
1.75
5
1.3
1.3
21.8
2.00
7
1.8
1.8
23.5
2.25
9
2.3
2.3
25.8
2.50
14
3.5
3.5
29.3
2.75
17
4.3
4.3
33.5
3.00
35
8.8
8.8
42.3
Valid
3.25
31
7.8
7.8
50.0
3.50
43
10.8
10.8
60.8
3.75
40
10.0
10.0
70.8
4.00
48
12.0
12.0
82.8
4.25
24
6.0
6.0
88.8
4.50
24
6.0
6.0
94.8
4.75
16
4.0
4.0
98.8
5.00
5
1.3
1.3
100.0
Total
400
100.0
100.0
Figure 21. Table 7 :7
Frequency
Percent
Valid Percent
Cumulative Percent
1.25
2
.5
.5
.5
1.5
2
.5
.5
1.0
1.75
6
1.5
1.5
2.5
2
8
2.0
2.0
4.5
2.25
16
4.0
4.0
8.5
2.5
21
5.2
5.2
13.8
2.75
27
6.8
6.8
20.5
3
43
10.8
10.8
31.2
Valid
3.25
33
8.2
8.2
39.5
3.5
36
9.0
9.0
48.5
3.75
28
7.0
7.0
55.5
4
46
11.5
11.5
67.0
4.25
41
10.2
10.2
77.2
4.5
33
8.2
8.2
85.5
4.75
29
7.2
7.2
92.8
5
29
7.2
7.2
100.0
Total
400
100.0
100.0
Note: KKnowledge Sharing Behavior of Physicians (Dentists) in Hospitals
Figure 22. Table 5 :5
Path Coefficient
Model 1 (Theory of Planned Behavior)
Model 2
AT
IN
0.21
0.10
SN
IN
0.21
0.70
PBC
IN
0.2
0.75
Appendix A
Appendix A.1
Most physicians who are important to me SN2: ...think that I should share knowledge
with other physicians. SN3: ...share their knowledge with others physicians whose
opinions I value SN4: ...would approve of my behavior to share knowledge with other
physicians. SN5: ...share their knowledge with others Perceived behavioral control
(PBC: 4 items) PBC1: For me to share my knowledge is possible always PBC2: If I want,
I always could share knowledge PBC3: It is mostly up to me whether or not I share
knowledge PBC4: I believe that there are much control I have to share my knowledge
with other physicians. Most physicians who are important to me SN2: ...think that
I should share knowledge with other physicians. SN3: ...share their knowledge with
others physicians whose opinions I value. SN4: ...would approve of my behavior to
share knowledge with other physicians. SN5: ...share their knowledge with others-this
is further as
Perceived behavioral control (PBC: 4 items) PBC1: For me to share my knowledge is
possible always. PBC2: If I want, I always could share knowledge. PBC3: It is mostly
up to me whether or not I share knowledge. PBC4: I believe that there are much control
I have to share my knowledge with other physicians. .
Appendix B
If only we knew what we know identification and transfer of internal best practices.
C O' Dell
, C J Grayson
. California Management Review1998. 40 (3) p. .
Knowledge sharing behavior of physicians in hospitals Seewon Ryua,*, Seung Hee Hob,
(Ingoo Hanb)