1. Introduction
he Healthcare Industry in India is expected to touch 280 billion USD in 2020 1 .The diagnostic medical imaging equipment such as X-rays, Digital radiography, and CT Scans contribute 75 percent of the total market share 2 . The existing doctor and patient ratio in India are1: 30,000, which is far less than WHO recommendation 3 of 1:1000. The refurbishment market for diagnostic medical imaging has been a powerful contributor in India and expected to grow further. More than 200 Billion USD investment in medical infrastructure creation is projected to fulfill the demands forecasted for Tier II and Tier III cities of Indian market 4 before 2020. Among 106 markets registered for the trading of refurbished medical devices, 85 markets permit the unrestricted importation of used medical devices, including India 5 . Most of the hospitals and diagnostic centers prefer refurbished diagnostic imaging equipment (CT, BMD, X-ray, and Mammography) due to lower cost without compromising the image quality. There have been no restrictions for the importation of the used medical imaging devices until 2015, by the regulator Atomic Energy Regulatory Body (AERB). However, effective September 2015, AERB has made an amendment in the regulatory process which restricts the importation of more than seven years old Pre-owned Medical X-ray equipment in the Country 6 . This change in regulatory norm has necessitated for a comprehensive review of the existing process practices to contain the excessive radiation.
2. D
The radiation studies have shown loss of six days of life expectancy due to diagnostic imaging Xrays 7 . The recommended radiation dose for initial diagnosis is between 0.1 and 100 mSv, while for therapeutic radiation it is between 20 -60 Gy 8 . CT studies have revealed that more than 50 percent of the effective dose was contributed by diagnostic radiology 9 . Exposure beyond threshold levels was reported due to improper adjustments of operational controls 10. There were more than 62 million CT examinations per year 11, and the increasing number of recommendation for CT scan is a serious cause of concern 12 . Studies have predicted more than 29,000 future cancers could be related to CT Scans 13 . The Exposure Index recommended by equipment manufacturers as a measure of radiation dose effectiveness was found to have inconsistencies 14 . The modern technologically driven radiation equipment offer high precision imaging with low dose levels 15 . These research studies mandate the need for immediate change over to innovative new technology medical imaging equipment by gradually eliminating the use of traditional technology equipments including refurbished X-ray equipments. This, establishes the need for stringent compliance with regulatory guidelines and standards towards protecting the existing installed base of X-ray equipment from excessive ionizing radiation and induce the adoption of newer generation equipment.
Studies related to regulatory compliance to contain ionizing radiation in Diagnostic Laboratories have shown adequate gaps in implementation 16
3. Research Objectives
To compare radiation compliance score based on the best practices recommended by the regulator (AERB) among Corporate Hospitals, Government Hospitals, Chain of Diagnostic Centers and Private Diagnostic Centers who are the consumers of X-ray equipments and analyze any significant variation exists.
V.
4. Research Design
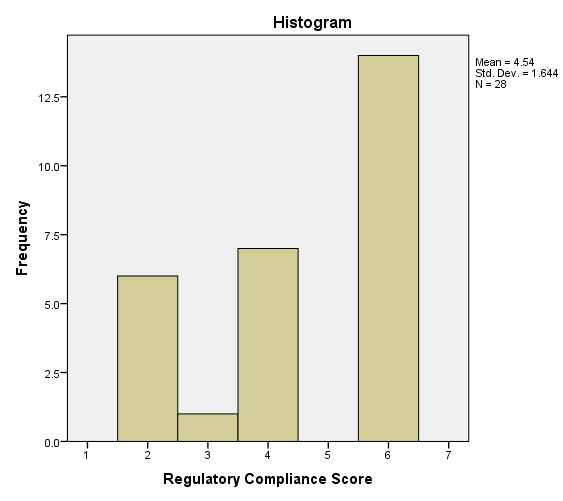
This Descriptive Research aims at studying the current best practices followed by the institutions housing diagnostic imaging equipment, to contain excessive ionizing radiation based on the recommendations of regulatory standards. This study has covered 25 different cities across Tamil Nadu, India and covered 451 institutions (229 Private Diagnostic Centers, 107 Chain of Diagnostic Centers, 77 Corporate hospitals, and 38 Government hospitals). This study has followed "Stratified Purposive" sampling to ensure adequate representations from the entire stratum. A structured Questionnaire with a seven-point scale (Table I) was administered to collect data from the institutions housing diagnostic imaging equipment. The researcher conducted this study for the period between April 2016 and September 2017. The instrument reliability was tested using Cronbach's Alpha, and it was calculated to be 0.992 (Acceptable threshold limit is 0.8). The sampling adequacy was estimated using Kaiser-Meyer-Olkin test and was estimated to be 0.93839 (Acceptable limit is minimum 0.6).
5. Kruskal-Wallis Test
The Kruskal-Wallis test (Kruskal, & Wallis, 1952) was chosen to test the hypothesis, 'Significant difference exists in the mean ranks of compliance score between these institutions.' A descriptive analysis (Table II ANOVA was performed using absolute mean rank distribution values and results shown in Table III. The researcher rejected the null hypothesis based on the estimated 'P' value ('0'-zero) which is less than Alpha (0.05) value, and so it has been concluded that the variances are not roughly marginal.
6. VIII.
7. Kruskal-Wallis Test
The test was conducted using SPSS (version 20), and test results of Kruskal-Wallis test have been compiled and presented in Table IV The assumption on the existence of marginating variable was first tested to use the power of Kruskal-Wallis test. The marginating variable was tested with the help of the following hypothesis. .000
From the Kruskal-Wallis test results, the estimated 'P' value is '0" (Zero) which is less than the alpha value (0.05), and hence the hypothesis of 'There will be a significant difference in compliance score between these groups' has been accepted. There is a significant difference between mean ranks of Private Diagnostic Centers and Chain of Diagnostic Centers. However, the mean rank estimated for Government hospitals and corporate hospitals are found to be the same. The results though have shown a significant difference between the groups; it did not point out which group contributes notable variance. Hence the effect size was estimated using Chi-Square value (Chi-Square Value / n -1 *100) and found to be 85.37 percent. This predicts 85.37 percent variability in mean rank is affected by the type of institutions.
The following groups formed to repeat the Kruskal-Wallis test to find out the group (s) that statistically significant from each other, and results are summarized:
1. Between Diagnostic Centers and Chain of Diagnostic Centers ( .432
The mean rank between Chain of Diagnostic Centers and Diagnostic Centers has been found to be statistically insignificant from the results of Kruskal-Wallis test with an estimated 'P' value of 0.432, which is higher than the alpha value 0.05. Furthermore, Diagnostic centers and Chain of diagnostic centers attribute 4.41 percent of the variability in the mean rank. The mean rank between corporate hospitals and Government hospitals has been found to be statistically insignificant from the results of Kruskal-Wallis test with an estimated 'P' of 1.00, which is higher than the alpha value 0.05. The 'Zero' chi-square value indicates that there is no significant difference in mean rank between Government hospitals and Corporate hospitals.
8. Regulatory
9. IX.
10. Conclusion
It was evident from the analysis that there is a significant difference in regulatory compliance score between the groups of institutions compared. The mean compliance score of Private Diagnostic centers (2.8, Table I) enunciates that dissemination of radiation containment standards into best practices was found to be marginally less than significant levels. The Chain of Diagnostic centers have established practices whose compliance was closely above sufficient levels (mean score 3.29,
| A Comparative Analysis of Factors Influencing Compliance to Contain Man-Made Ionizing Radiation in | ||||||||
| Diagnostic Medical Imaging Devices | ||||||||
| Year 2018 | ||||||||
| Volume XVIII Issue 1 Version I | ||||||||
| D D D D ) D | ||||||||
| ( | ||||||||
| Sl. No. | Description of Variable | N | Median Mode | Mean | Std. Dev | Skewness Kurtosis | ||
| 1 | Overall | 28 | 5 | 6 | 4.54 | 1.654 | -0.526 | -1.348 |
| 2 | Private Diagnostic Centers | 7 | 2 | 2 | 2.8 | 1.069 | 0.374 | -2.800 |
| 3 | Chain of Diagnostic Centers | 7 | 4 | 4 | 3.29 | 0.951 | -1.678 | -0.764 |
| 4 | Corporate Hospitals | 7 | 6 | 6 | 6 | 0 | 0.764 | 1.587 |
| 5 | Government Hospitals | 7 | 6 | 6 | 6 | 0 | 0.794 | 1.587 |
| © 2018 Global Journals | ||||||||
| Sum of Squares | df | Mean Square | F | Sig. ('P' Value) | |
| Between Groups | 862.607 | 3 | 287.536 | ||
| Within Groups | 173.357 | 24 | 7.223 | 39.807 | .000 |
| Total | 1035.964 | 27 |
| Compliance Score 2 2 4 4 | Group 1 1 1 1 | Group Description Diagnostic Centers | Rank 3.500 3.500 11.000 11.000 | Mean Rank Distribution 2.86 2.86 2.86 2.86 | Absolute Mean Rank Distribution .64 .64 8.14 8.14 | Medical Research |
| 2 4 2 3 2 2 4 4 | 1 1 1 2 2 2 2 2 | Chain of Diagnostic Centers | 3.500 11.000 3.500 3.500 7.000 3.500 11.000 11.000 | 2.86 2.86 2.86 3.29 3.29 3.29 3.29 3.29 | .64 8.14 .64 .21 3.71 .21 7.71 7.71 | Global Journal of |
| 4 | 2 | 11.000 | 3.29 | 7.71 | ||
| 4 | 2 | 11.000 | 3.29 | 7.71 | ||
| 6 | 3 | 21.500 | 6.00 | 15.50 | ||
| 6 | 3 | 21.500 | 6.00 | 15.50 | ||
| 6 | 3 | 21.500 | 6.00 | 15.50 | ||
| 6 | 3 | Government Hospitals | 21.500 | 6.00 | 15.50 | |
| 6 | 3 | 21.500 | 6.00 | 15.50 | ||
| 6 | 3 | 21.500 | 6.00 | 15.50 | ||
| 6 | 3 | 21.500 | 6.00 | 15.50 |
| 6 | 4 | 21.500 | 6.00 | 15.50 | ||
| 6 | 4 | 21.500 | 6.00 | 15.50 | ||
| 6 | 4 | 21.500 | 6.00 | 15.50 | ||
| 6 | 4 | Corporate Hospitals | 21.500 | 6.00 | 15.50 | |
| 6 | 4 | 21.500 | 6.00 | 15.50 | ||
| 6 | 4 | 21.500 | 6.00 | 15.50 | ||
| 6 | 4 | 21.500 | 6.00 | 15.50 | ||
| Type of Institutions | N | Mean Rank | ||||
| Diagnostic centers | 7 | 6.71 | ||||
| Regulatory Compliance Score | Chain of Diagnostic Centers Government Hospitals | 7 7 | 8.29 21.50 | |||
| Corporate Hospitals | 7 | 21.50 | ||||
| Total | 28 | 6.71 | ||||
| Regulatory Compliance Score | ||||||
| Chi-Square | 23.988 | |||||
| df | 3 | |||||
| Asymp. Sig. | ||||||
| & VIII). | |||
| 2. Between Chain of Diagnostic Centers and | |||
| Government Hospitals (Table IX & X). | |||
| 3. Between Government hospitals and Corporate | |||
| Hospitals (Table XI & XII). | |||
| Type of Institutions | N | Mean Rank | |
| Regulatory Compliance Score | Diagnostic centers Chain of Diagnostic Centers | 7 7 | 6.71 8.29 |
| Total | 14 | ||
| Regulatory Compliance Score | |||
| Chi-Square | 0.617 | ||
| df | 1 | ||
| Asymp. Sig. | |||
| A Comparative Analysis of Factors Influencing Compliance to Contain Man-Made Ionizing Radiation in | |||
| Diagnostic Medical Imaging Devices | |||
| Year 2018 | |||
| Volume XVIII Issue 1 Version I | |||
| D D D D ) D | |||
| ( | |||
| Type of Institutions | N | Mean Rank | |
| Compliance Score | Chain of Diagnostic centers Government Hospitals | 7 7 | 4.00 11.00 |
| Total | 14 | ||
| © 2018 Global Journals | |||
| Regulatory Compliance Score | ||||
| Chi-Square | 11.492 | |||
| df | 1 | |||
| Asymp. Sig. | 0.001 | |||
| The mean rank between Diagnostic Centers | alpha value 0.05. However, Diagnostic centers and | |||
| and Government hospitals has been found to be | Government hospitals accredit 82.09 percent of the | |||
| statistically significant from the results of Kruskal-Wallis | variability in mean ranks. | |||
| test with an estimated 'P' of 0.001, which is less than the | ||||
| Type of Institutions | N | Mean Rank | ||
| Regulatory Compliance Score | Corporate Hospitals Government Hospitals | 7 7 | 7.50 7.50 | |
| Total | 14 | |||
| Regulatory Compliance Score | ||||
| Chi-Square | 0.000 | |||
| df | 1 | |||
| Asymp. Sig. | 1.000 | |||
| Year 2018 |
| Volume XVIII Issue 1 Version I |
| D D D D ) |
| ( |
| © 2018 Global Journals |