1. Introduction
epatitis B is a viral infection worldwide that invades the liver and can provoke both severe and persistent diseases. HBV: Hepatitis B virus transmits sexually, parenterally, or perinatally. HBV chronically infects over 248 million people worldwide [1][2] .
Antivirals are drugs that kill a virus or suppress their capability to reproduce. The focus of antiviral medicine is to reduce symptoms, infectivity, and to minimise the span of illness. Antiviral drugs act at various stages by arresting the cycle of viral replication [3] .
Entecavir Monohydrate: The hydrated form of Entecavir is Entecavir Monohydrate: a synthesized analog of 2'deoxyguanosine and a nucleoside reverse transcriptase inhibitor with selective antiviral action against the hepatitis B virus (Fig. 1). It phosphorylates intracellularly with the dynamic triphosphate form, which contests with deoxyguanosine triphosphate (a natural substrate of the virus hepatitis B reverse transcriptase), suppressing every phase of the enzyme's action; at the same time, it bears no activity against HIV. USFDA authorized it in March 2005. The IUPAC name of Entecavir monohydrate is a 2-amino-9-[(1S, 3R, 4S)-4-hydroxy-3 (hydroxymethyl)-2methylidenecyclopentyl]-1H-purin-6-one; hydrate. Its molecular formula and molecular weight is C 12 H 17 N 5 O 4 and 295.29 g/mole, respectively.
It's a non-hygroscopic, off white to white powder, practically insoluble in acetonitrile, sparingly soluble in N, N-dimethylformamide, slightly soluble in methanol, ethanol (99.5%) and water (2.4 mg/ml at pH 7.9, 25°C) [4] . Store Entecavir tablets in a tightly closed container at 25° C (77° F); excursions permitted between 15-30° C (59-86° F) [5] .
Technique: Spectroscopy is the measurement of the interaction of light with various materials. To determine a chemical substance, analyze the amount of light
H N H N N N O N H 2 CH 2 O H O H O H 2absorbed or emitted by a sample. Infrared spectroscopy (IR spectroscopy) is a technique based on the vibrations of the atoms of a molecule. An infrared spectrum is obtained by passing infrared radiation through a sample and determining what fraction of the incident radiation absorbs at a particular energy. The energy at which any peak in an absorption spectrum appears corresponds to the frequency of vibration of a part of a sample molecule [6] .
Fourier-transform infrared (FTIR) spectroscopy is based on the idea of the interference of radiation between two beams to yield an interferogram. The latter is a signal produced as a function of the change of path length between the two beams. The two domains of distance and frequency are interconvertible by the mathematical method of Fourier-transformation [7] .
Derivative spectroscopy (DS) has been brought in for resolving overlapping peaks. DS approach is extensively adopted to intensify the signal and work out the overlapped peak-signals for its improvements in separating closely adjacent peaks and finding weak peaks covered by sharp peaks. When derivatized, the crests and troughs of the original peak function take hold of zero values, and the inflections are modified into maxima or minima, correspondingly. The curves of derivatization are better structured than the authentic spectra, therefore facilitating very slight distinctions to be singled out.
Advantages of DS are it clears up opportunities for enhancing selectivity and sensitivity; is employed to detect elements with significant accuracy with no preceding step; is incredibly practical when overlap or interference occurs; it extends a dynamic medium for qualitative and quantitative analyses of mixtures; and it is easy to eliminate specimen turbidity matrix background, to improve spectral details and to get rid of the effect of baseline shifts and baseline tilts [8] .
After reviewing ample of available literature, we planned this work to develop and validate a sensitive second derivative technique based on FTIR, for estimation of Entecavir Monohydrate in its pure and pharmaceutical dosage form .
2. II.
3. Method
4. Materials and Reagents (
5. a) Method Development
Liquid cell and KBr press were utilized for sampling liquids and solids, respectively. We developed FTIR spectroscopic method using an FTIR instrument with the parameters in Table 4.
6. ii. Preparation of the working standard mixture
From the stock (200 µg/mg), accurately weighed 6.250, 12.500, 25.000, 50.000 mg was taken and diluted to 100 mg with dried KBr to create the eventual concentrations of 12.5, 25, 50, and 100 µg/mg, respectively. We ensured uniform mixing.
7. iii. Extraction Procedure
Triturate twenty tablets (X-VIR* manufactured by NATCO Pharma Ltd., containing 1 mg of ETV) after taking their average weight. Then the tablet powder equivalent to 1 tablet was transferred to an Eppendorf tube and dissolved in methanol. It was vortexed for 2 minutes, followed by centrifugation at 5000 rpm for 10 minutes. Then the resulting supernatant was collected and evaporated overnight. The residue was collected (approximately 1 mg when weighed).
8. iv. Sample Preparation for Pressed Pellet Technique
The complete residue obtained was triturated with 50 mg of KBr to make a pellet of 20 ?g/mg, which we scanned in the absorbance mode, and the peak so recovered was derivatized to second order. We then calculated peak area of the derivatized peak.
9. v. Sample Preparation for Liquid Sampling Technique
Using the above extraction procedure, Entecavir monohydrate was extracted from its marketed formulation. Accurately weighed 1 mg of extract was transferred in a 10 ml volumetric flask, and suitable solvents were added individually in each flask, i.e., methanol, DMSO, methanol in chloroform.
10. c) Method Validation
The FTIR method was developed and validated for quantitative evaluation of ETV in tablets using the KBr pressed pellet technique corresponding to the ICH guidelines Q2 (R1): Validation of Analytical Procedures: Text and Methodology [32] .
i
11. . Linearity and Range
The working standard solutions of ETV were prepared and analyzed in the FTIR instrument. We recorded absorbance of the peaks at 1631cm -1 for standard solutions, and plotted the standard calibration curve between concentration and absorbance. Regression analysis established linearity; It reports the regression equation and the coefficient of determination.
12. ii. Limit of Detection (LOD) and Limit of Quantification (LOQ)
We estimated the responsiveness of suggested technique for measurement of ETV in terms of LOD & LOQ; and determined it using the standard deviation method. Then calculated, the standard deviation and slope from the calibration curve established for linearity parameter using the below-mentioned formulae: LOD = Sandell's sensitivity, defined as the lightest weight of a material that can be encountered in a column of a unit cross-section. The lowest concentration of ETV (12.5µg/mg) was prepared from the working standard solution (200µg/mg) and scanned several times. We noted the absorbance and calculated the Sandell's sensitivity using the formula given below:
?????????????? ? ?? ?????????????????????? (??) = ?????????????????????????? ? µg 100mg ? ???????????????????? ?????????? × 0.00113. iv. Precision
To establish precision of the method, we reported its repeatability. They usually use the standard deviation (SD) or percentage relative standard deviation (% RSD) of a course of evaluations to assess the rigor of a scientific technique. Precision was determined using repeatability, and calculated for only one stage of precision.
14. Repeatability
We determined repeatability by analyzing six replicates of 100µg/mg, and calculating their percent relative standard deviation (% RSD).
15. v. Accuracy
The accuracy of the method was reported as the percentage recovery of a known added measure of the analyte to a specimen or as the difference between the average value obtained and the accepted true value of a specimen, jointly with an associated confidence interval.
16. For the drug product
We determined the accuracy study of drug product by calculating the percentage recovery of the ETV using the standard addition method. By adding known amounts of the standard mixture of ETV (40, 50, and 60 ?g/mg), respectively, to a pre-quantified test mixture of ETV (50 ?g/mg). The calculation of percentage recovery was performed by measuring absorbance and qualifying these amounts into the regression equation of the calibration curve and by calculating the percent relative standard deviation (% RSD) at each stage.
vi. Assay of Entecavir Monohydrate tablets Triturate twenty tablets (X-VIR* manufactured by NATCO Pharma Ltd., containing 1 mg of ETV) after taking their average weight. Then the tablet powder equivalent to 1 tablet was transferred to an Eppendorf tube and dissolved in methanol. It was vortexed for 2 minutes, followed by centrifugation at 5000 rpm for 10 minutes. Then the resulting supernatant was collected and evaporated overnight. The residue was collected (approximately 1 mg when weighed). Later, the complete residue was triturated with 50 mg of KBr to make a pellet of 20 ?g/mg, which we scanned in the absorbance mode, and the peak so recovered was derivatized to second order. We then calculated peak area of the derivatized peak.
17. Results and Discussion
18. a) Development and Optimization of FTIR Method i. Solubility Studies
During developmental studies, we checked the drug solubility in methanol and chloroform and its combination. We found ETV solution of methanol in chloroform [50 µg/ml] to be the most reliable solution for solubility that can be studied on a UV-VIS spectrophotometer, giving ? max at 257 nm.
19. Solution Preparation
We took 10 mg of ETV along with a few ml of methanol in a volumetric flask, which was sonicated for 2 minutes, and made up to 10 ml with methanol to make methanol stock solution of concentration 1000 µg/ml. Then, 0.1, 0.5, and 1.0 ml of this methanol stock solution were made up to volume in other 10 ml volumetric flasks with chloroform to prepare solutions of 10, 50, and 100 µg/ml concentrations, respectively. An overlay of their spectra in Fig. 2.
20. ii. Analyte Solution Stability Studies
We found ETV solution to be stable for 1 hour after preparation, and carried out solution stability studies on UV-VIS Spectrophotometer, giving a ? max at 257nm for a concentration of 50 µg/ml. So observed a slight, yet gradual decrease in absorbance in Fig. 3 We carried out IR analyses using a Shimadzu 8400S FTIR instrument by pressed pellet technique and liquid sample techniques. FTIR method was developed using two sampling techniques: Liquid sampling and the Pressed Pellet Technique.
21. iii. Liquid Sampling Technique: (Drug Substance)
Characteristic functional group peaks were seen in the IR spectra of ETV solution of methanol in chloroform but not in those of methanol or DMSO alone, as shown in Fig. 4, 5 & 6. Also the required increase in functional group absorbance value with an increase in concentration, for quantitation of ETV, wasn't seen. We did not observe any sharp, functional group peaks in the IR spectra taken in DMSO. We did pelleting by geometric mixing of KBr with ETV. They use KBr press for sampling of solids. The FTIR spectrum of ETV standard exhibited well-defined bands and peak absorbance, which increased proportionally with increasing concentration, as shown in Fig. 7. B Thus, we developed the Derivative FTIR spectroscopic method using a solid pelleting technique on the FTIR spectrophotometer.
22. v. Sample Preparation
Performed various techniques and extraction procedures to achieve a better drug recovery from the tablet powder.
23. Solid Pelleting Technique (Formulation)
Trial I: Scooping Method One X-VIR* tablet accurately weighed and finely powdered, was transferred into a vial. We randomly scooped out 10 mg of this powder into an FTIR mortar pestle, and added 100 mg of KBr to make a pellet of concentration 100 ?g/mg. Then scanned this pellet, and the IR spectrum obtained for tablet by the scooping method is as in Fig. 8. Observation: We did not observe any peaks in the region of 1600-1750cm -1 , which indicated the absence of the drug in the scoop taken. Thus, scooping is not a reliable technique for sample preparation from the tablet.
24. Trail II: Extraction Method [X-VIR* Tablet in Methanol]
One X-VIR* tablet, accurately weighed, powdered finely was transferred into an Eppendorf tube. 1 ml of Methanol was added and centrifuged at 5000 rpm for 10 mins. We obtained a clear, supernatant liquid with a pink layer on top of white precipitate, which was collected in a new Eppendorf tube; kept open overnight for evaporation. The next day, we collected the precipitate in the FTIR mortar, and added 50mg of KBr to make a pellet of concentration 20 ?g/mg. This pellet was scanned to obtain IR spectrum as in Fig. 9. Observation: We observed significant peaks as that of pure ETV. However, all the peaks shifted towards higher wavenumber. We noticed C-O peak at 1685.67 cm -1 instead of 1633.59 cm -1 . The intensity of the peak in X-VIR* Tablet (0.531) was relative to standard ETV (0.403).
25. Trail III: Extraction Method [X-VIR* Tablet in Methanol in Chloroform]
The Extraction procedure was the same for all solvents, except for a change in:
1. Solvent and its volume -0.5 ml of Methanol, 0.
26. B
However, total volume is constant for the extraction procedure. IR spectrum so obtained is as in Fig. 10. Observation: We observed significant peaks as that of pure ETV. However, all the peaks shifted towards higher wavenumber. We noticed C-O peak at 1689.53 cm -1 instead of 1633.59 cm -1 . The intensity of the peak in X-VIR* Tablet (0.749) was relative to that of standard ETV (0.403).
27. Trail IV: Extraction Method [X-VIR* Tablet in Ethanol]
The extraction procedure was the same for all solvents, except for a change in:
1. Solvent and its volume -1.0 ml of Ethanol 2. Precipitate observed -white precipitate However, total volume is constant for the extraction procedure. IR spectrum so obtained is as in Fig. 11. Observation: We observed significant peaks as that of pure ETV. All the peaks shifted towards higher wave number. We noticed C-O at 1689.53 cm -1 instead of 1633.59 cm -1 . The intensity of the peak in X-VIR* Tablet (0.434) was relative to standard ETV (0.403).
28. vi. Liquid Sampling Technique: (Formulation)
One tablet was weighed accurately, finely powdered, and extracted using 1 ml of Methanol. We took 1.0 ml of supernatant liquid in a 10 ml volumetric flask, and made up the volume with methanol to make a stock solution of 100?g/ml. It gave high-intensity peaks. The peak at 1708.81cm -1 may be due to C=O stretch, as shown in Fig. 12. From the stock solution, 0.1, 1.0 and 5.0 ml was taken into different 10 ml volumetric flasks, and the volume was made up with chloroform to make the solutions of concentration 1, 10 and 50?g/ml respectively. Their spectra so obtained are shown in Fig. 13, 14 & 15 correspondingly. Peaks at 1600.81cm -1 and 1710.74 cm -1 may be due to C=O stretch. These graphs were studied as obtained for the above solutions in various concentrations. Scans for liquid sampling cell were measured in transmittance mode, to get better results. The graphs were not clear.
They exhibited very high transmittance values at most concentrations. Also, functional group shifts were observed, most likely due to the interface from excipients. 6) The band chosen for quantization should be in a region of the spectrum free from absorption by other possible components of the sample. So we selected the following parameters to get better peaks that can be derivatized to estimate the amount of Entecavir Monohydrate present in the sample taken (Table 7). Entecavir monohydrate IR spectrum showed peaks at 1631cm -1 , 3112cm -1 , 3186cm -1 , and 3446cm -1 corresponding to the C-O stretch, primary amine's two N-H stretches and free O-H stretch, respectively. Among these, the C-O group showed a clear and intense peak, which increased linearly as the concentration was increased. Hence, we selected the C-O group for the quantitative evaluation of Entecavir monohydrate.
29. vii. Comparative Study of Sample Preparation (Table
30. ix. Verification of Beer's Law
We observed a linear and proportional correlation linking the concentration, and absorbance in
31. b) Validation of Developed FTIR Method for Quantitative Estimation of Entecavir Monohydrate
We performed the validation for this originated FTIR approach as per ICH Q2 (R1) guidelines, and found all the specifications to be within allowable limits.
32. i. Linearity of ETV
Working standard solutions of ETV were prepared and analyzed in the investigational concentration range of 12.5-200 µg/mg, as shown in Fig 17-21 and Table 9. We recorded the peak area of the second-order derivative of the C=O peak at 1631cm -1 for the standard solutions. The standard calibration curve was plotted between concentration and peak area to establish linearity by regression analysis, as shown in Fig. 16, Table 8. Corrected value: Yes Equation:
Corr. Area = -4.642E-2 -1.474E-3 * c^1, r = 0.992494
We found the response of the drug to be linear in the investigational concentration range 12.5-200 ?g/mg by acquiring the regression equation, y = 0.0015x + 0.0387, and coefficient of determination, R 2 = 0.9999 for the second derivative of obtained spectra in absorbance mode. ETV obeyed Beer -Lambert's law in the investigational concentration range.
33. ii. Limit of Detection (LOD) and Limit of quantitation (LOQ) of ETV
We estimated the sensitivity of the proposed method for measurement of ETV for both UV and Derivative FTIR values in terms of LOD & LOQ, which were determined using the standard deviation method. Standard deviation (??) and slope (??) were calculated from the calibration curve for linearity of each method, respectively, as shown in Table 10. We found the LOD and the LOQ values to be 3.29 and 9.96 µg/mg, respectively, which indicates the sensitivity of the method.
iii. Sandell's Sensitivity The Sandell's sensitivity was calculated based on the absorbance value of the lowest concentration, 12.5 µg/mg when scanned several times and derivatized to second order. We noted the absorbance(s) and found the Sandell's sensitivity to be 0.0437 µg/cm 2 /0.001 Abs unit.
34. iv. Precision
We reported the precision of the originated analytical technique in terms of repeatability, which was determined by analyzing 6 replicates at 100% concentration [100?g/mg] of ETV to obtain spectra from IR Solution software in second derivative mode. Later, B we calculated the mean, standard deviation, and %RSD in MS-Excel (Method Precision). Finally, we calculated the percentage relative standard deviation (%RSD) and found it to be within limits (NLT 2.0% and NMT 10.0%) [32] , as shown in Table 11 and Fig. 22. Hence the method is repeatable and precise. To check system precision, we scanned one sample of ETV at 100% concentration [100 ?g/mg] six times, and found the %RSD to be within limits (NMT 2.0%) [32] , as shown in Table 12 and Fig. 23. Hence the system is capable of giving precise results. We carried out an accuracy study by calculating the percent recovery of ETV by the standard addition method. Known amounts of standard ETV (40, 50, and 60?g/mg) were added to a pre-quantified test mixture of X-VIR* tablet extract (50 ?g/mg). The percent recovery was calculated by measuring the peak area, and fitting these values into the regression equation of the calibration curve. Concentrations recovered are tabulated in Table 13.
Table 13: Recovery data for Entecavir Monohydrate drug product (X-VIR* tablets)
35. *Average of 3 determinations
Overlay spectra of the three recovery curves of Entecavir Monohydrate recovered from the marketed formulation of X-VIR* tablets at the spike levels of 80-120% in absorbance and second derivative modes are as in Fig. 24 We found the method to be accurate for the determination of Entecavir monohydrate in tablets as the percentage recovery values calculated were found to be within the acceptable limits (100±2%) [32] .
36. vi. Assay
Assay means to provide an exact result that allows an accurate statement on the content or potency of the analyte in a sample. -ICH Q2(R1). The peak area value of the specimen scanned in absorbance mode (Fig. 26) and derivatized to second-order (Fig. 27) was substituted into the regression equation of the calibration curve to obtain its concentration, which we used ultimately to calculate its purity as shown in Table 14. The shift in the absorbance value of the C=O peak from 1631.67 cm -1 to 1689.53 cm -1 is due to the interference of excipients in the marketed formulation [34] .
IV.
37. Comparitive Analysis
To ensure this developed technique is appropriate and superior to existing analytical methods, we performed a few validation parameters on previously developed and published UV and HPLC methods from various journals and Indian pharmacopeia [35,36] . The results so obtained were compared with the current derivative FTIR method to prove this new technique is equally good.
38. a) Linearity of ETV on UV-VIS Spectrophotometer
The linearity was established on UV-VIS Spectrophotometer by performing linear analysis for the calibration curve constructed between concentration and absorbance. The investigational concentration ranges of 15-50 µg/ml (Fig. 29) were found to be linear and obeying Beer -Lambert's Law, as shown in Table 15 and Fig. 28. We found the regression equation to be y = 0.0232x + 1.5492 with correlation coefficient, R 2 = 0.9942. b) UV-VIS Spectroscopy v/s Second Derivative FTIR Spectroscopy (Table 16) We dissolved the pure drug of ETV and the residue obtained from extracted X-VIR* tablet in methanol (1000 µg/ml) and spiked it in 10 ml chloroform to obtain the standard stock solutions of 100 µg/ml each, respectively.
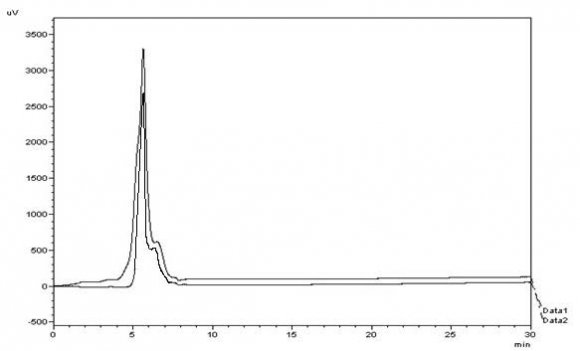
Then we injected these solutions into the RP-HPLC, and the overlay chromatogram so obtained is shown in Fig. 30, We found the mean value of % purity for the second derivative FTIR method to be 99.75% and that of RP-HPLC to be 90.04% from Table 18. We calculated the assay result of Entecavir monohydrate by both methods. Statistical analysis of the outcomes of the two techniques showed a significant difference between the techniques at a significance level ( ??) of 5% (t calculated > t critical ). Furthermore, the amount of Entecavir monohydrate calculated by both procedures was within the range between 90 -110%. Since variances of the population were not known and size of the samples was small, t-test for difference in means was adopted assuming the populations to be normal and we worked out the test statistic t under the given formula: As our hypothesis was two-sided, we applied a two-tailed test for determining the rejection regions at 5 percent level which came to as under, using the table of t-distribution for 4 degrees of freedom:
R: | t | > 2.776The observed value of t was 3.453 (t calculated > t critical ), which falls in the region of rejection of our hypothesis. So we reject our hypothesis of both methods not being significantly different and conclude that the two ways to determine the percentage purity of Entecavir monohydrate differ significantly.
V.
39. Conclusion
The developed method for estimation of Entecavir monohydrate is based on the application of FTIR with derivative assistance by using the solid pellet technique, which was compared statistically with the pharmacopoeial method (HPLC), and the results revealed that the developed new technique was significantly different. Hence it proves good applicability. It fulfilled all validation requirements in a range of concentrations, and they can use this technique as an alternative to the official methods.
It is suitable for quality control of both pure and marketed solid dosage form, and similar methods can be developed for other categories of drugs for their estimation in the formulations.


![Figure 2: Overlay of drug solubility profile Red -ETV in CH 3 OH [100 µg/ml]; Green -ETV in CH 3 OH in CHCl 3 [10 µg/ml]; Blue -ETV in CH 3 OH in CHCl 3 [50 µg/ml]; Black -ETV in CH 3 OH in CHCl 3 [100 µg/ml]](https://medicalresearchjournal.org/index.php/GJMR/article/download/2165/version/101381/3-Development-and-Validation-of-Derivative_html/22842/image-5.png)
![Figure 3: Overlay of analyte stability spectra for ETV [50 µg/ml]](https://medicalresearchjournal.org/index.php/GJMR/article/download/2165/version/101381/3-Development-and-Validation-of-Derivative_html/22843/image-6.png)

| 2 & 3) |
| S. No. | Chemicals | Category |
| 1. | Potassium Bromide Anhydrous | IR Grade |
| 2. | Dimethyl Sulfoxide | AR Grade |
| 3. | Chloroform | HPLC Grade |
| 4. | Water | HPLC Grade |
| 5. | Methanol | HPLC Grade |
| S.No. | Name | Manufacturer/ Supplier |
| 1. | Entecavir Monohydrate (Pure form) | Gift sample from Dr.Reddy's Laboratories, Hyderabad. |
| 2. | X-VIR* Tablets (Marketed Formulation) | Bought from a local pharmacy store |
| S.No. | Instruments | Make and model | Software |
| 1. | FTIR Spectrophotometer | Shimadzu -8400S | IR Solutions (Ver. 1.21) |
| 2. | UV-VIS Spectrophotometer | Shimadzu -1800 | UV Probe (Ver. 2.43) |
| 3. | HPLC | Shimadzu -LC-20AT | LC Solution (Ver. 1.25) |
| 4. | Electronic Balance | Shimadzu -BL220H | -NA - |
| 5. | Ultra-Sonic Bath Sonicator | PCI Analytics -6.5 li200H | -NA - |
| 6. | Hot Air Oven | BTI Mumbai -105 | -NA - |
| S.No. | Parameter | Selected Condition |
| 1. | Selection of Measurement Mode | Absorbance Mode |
| 2. | Selection of Beam | Internal |
| 3. | Selection of Detector | Standard DLATGS detector |
| 4. | Selection of Mirror Speed | 2.8 mm/sec |
| 5. | Selection of Sampling Technique | Pressed Pellet technique |
| 6. | Selection of Apodization | Happ-Genzel |
| 7. | Selection of solvent (based on IR transparency window) | For Liquid: Chloroform, Dimethyl sulfoxide and methanol For Solid: Potassium Bromide |
| 8. | Analysis of IR Spectra for Functional Group Assessment | ETV IR Spectrum: Peak at 1631 cm -1 , C-O stretch Clear, intense peak, increased linearly with concentration. |
| b) Method Optimization | ||
| i. Preparation of standard stock of Entecavir | ||
| monohydrate | ||
| Accurately weighed 40 mg of the Entecavir | ||
| monohydrate was geometrically mixed with 200 mg of | ||
| dried KBr to form the stock of 200?g/mg. Mix the | ||
| triturate well, such that each pellet formed contained | ||
| the uniformly distributed drug. | ||
| Year 2020 |
| 16 |
| S.No. | Time Point (hours) | Absorbance (A) at 257nm |
| 1. | 0 -Black | 2.265 |
| 2. | 0.5 -Red | 2.258 |
| 3. | 1 -Blue | 2.238 |
| 4. | 3 -Pink | 2.102 |
| 5. | 4 -Green | 2.050 |
| 3.495 | |||||
| 3.000 | |||||
| 2.000 | |||||
| Abs. | 1.000 | ||||
| 0.000 | |||||
| -1.000 Figure 5: IR spectrum of Entecavir Monohydrate pure in DMSO by liquid sampling technique -1.333 (Transmittance mode) | Year 2020 | ||||
| 236.64 250.00 | 300.00 | 350.00 | 17 | ||
| nm. | |||||
| Volume XX Issue V Version I | |||||
| D D D D ) B | |||||
| ( | |||||
| Medical Research | |||||
| 75 100 %T | Global Journal of | ||||
| 50 | |||||
| 4000 | 3000 | 2000 | 1500 | 1000 | 500 |
| ECMHT200LIQB | 1/cm | ||||
| © 2020 Global Journals | |||||
| 100 | |||||||||||||
| %T | |||||||||||||
| 90 | |||||||||||||
| 80 | |||||||||||||
| Year 2020 | 4000 | 3000 | 2000 | 1500 | 1000 | 5 | |||||||
| 18 | |||||||||||||
| Volume XX Issue V Version I | 0 50 100 %T | ||||||||||||
| D D D D ) | 4000 | 3000 | 2000 | 1500 | 1000 | ||||||||
| ( | |||||||||||||
| Medical Research | |||||||||||||
| Global Journal of | 50 %T | ||||||||||||
| 25 | |||||||||||||
| 894.91 | |||||||||||||
| 0 | 3446.56 | 3186.18 | 3112.89 | 1724.24 | 1687.60 | 1631.67 | 1600.81 | 1577.66 | 1541.02 | 1487.01 | 1400.22 | ||
| 3000 | 2000 | 1500 | 1000 | 5 | |||||||||
| S.No. | Parameters | Solid Pelleting Technique | Liquid Sampling Technique |
| 1. | Sample Preparation | Tricky and requires good skill as the quantity is too small | Requires skill, however is comparatively easy |
| 2. | Mode of Measurement | Absorbance Mode | Transmittance Mode |
| 3. | Derivatization | Gives single, almost symmetrical peak | Gives Bifurcated, unsymmetrical peak |
| 4. | Intensity | Within normal range, when compared to standard ETV | Very high intensities, when compared to standard ETV |
| 5. | Sensitivity | Very High | Fairly Acceptable |
| 6. | Selectivity | High, improved peak shape | Low, distorted peaks |
| 7. | Stability | Partial decomposition of pellets | Complete decomposition of solution |
| S.No. | Parameter | Optimized Condition |
| 1. | Frequency Range | 400-4000 cm -1 |
| 2. | Maximum No. of Scans | 10 (for better S/N ratio) |
| 3. | Resolution | 8 cm -1 (for better peak-to-peak separation) |
| 4. | Beer-Lambert's Concentration Range | 12.5-200 ?g/mg |
| viii. IR Spectrum Analysis for Functional Group | ||
| Assessment | ||
| S.No. | Concentration (µg/mg) | *Peak Area [1639.38-1620.09 cm -1 ] |
| 1. | 12.5 | 0.0554 |
| 2. | 25.0 | 0.0751 |
| 3. | 50.0 | 0.1134 |
| 4. | 100.0 | 0.1859 |
| 5. | 200.0 | 0.3306 |
| *Average of 3 determinations | ||
| ECMHP12 Overlay\ECMHP12 ECMHP25 Overlay\ECMHP25 | 1631. | ||||||||
| ECMHP50d Overlay\ECMHP50d | |||||||||
| ECMHP100d Overlay\ECMHP100d | |||||||||
| 3 | ECMHP200 Overlay\EECMHConc2 | ||||||||
| Abs | 1633.59 1633.59 1631.671631.67 | ||||||||
| Abs/(1/cm)^2 | |||||||||
| 0.025 | ECMHP200\Second Derivative ECMHP100\Second Derivative ECMHP50\Second Derivative ECMHP25\Second Derivative ECMHP12\Second Derivative | 1635.52 1639.38 1639.38 1639.38 | 1620.09 1618.17 1620.09 1620.09 | ||||||
| 0 | |||||||||
| -0.025 | |||||||||
| -0.05 | |||||||||
| 1750 | 1700 | 1650 | 1600 | 1550 | 1500 | 1450 | 1400 | ||
| Name of the drug | LOD (µg/mg) | LOQ (µg/mg) |
| Entecavir Monohydrate | 3.29 | 9.96 |
| S.No. Concentration (g/mg) | Peak Area | Mean*±Standard Deviation | %RSD | |
| 1. | 100 | 0.2296 | ||
| 2. | 100 | 0.2242 | ||
| 3. | 100 | 0.2527 | ||
| 0.2370 ± 0.0124 | 5.23 | |||
| 4. | 100 | 0.2556 | ||
| 5. | 100 | 0.2323 | ||
| 6. | 100 | 0.2275 | ||
| Abs/(1/cm)^2 | |||||
| Repeatability 1\Second Derivative | |||||
| Repeatability 2\Second Derivative | |||||
| 0.02 | 1639.38 1639.38 1639.38 1639.38 1639.38 1639.38 Repeatability 3\Second Derivative Repeatability 4\Second Derivative Repeatability 5\Second Derivative Repeatability 16\Second Derivative | 1620.09 1620.09 1620.09 1620.09 1620.09 1620.09 | |||
| 0 | |||||
| -0.02 | |||||
| 1642.5 | 1635 | 1627.5 | 1620 | 1612.5 | |
| S.No. | Concentration ( g/mg) | Peak Area | Mean*±Standard Deviation | %RSD | |
| 1 | 100 | 0.2381 | |||
| 2 | 100 | 0.2389 | |||
| 3 4 | 100 100 | 0.2365 0.2317 | 0.2365 ± 0.027 | 1.16 | |
| 5 | 100 | 0.2342 | |||
| 6 | 100 | 0.2394 | |||
| Abs/(1/cm)^2 | |||
| Repeatability 1a\Second Derivative | |||
| Repeatability 1b\Second Derivative | |||
| 0.02 | Repeatability 1c\Second Derivative 1639.38 1639.38 1639.38 1639.38 1639.38 1639.38 Repeatability 1d\Second Derivative Repeatability 1e\Second Derivative Repeatability 1f\Second Derivative | 1620.09 1620.09 1620.09 1620.09 1620.09 1620.09 | |
| 0 | |||
| -0.02 | |||
| 1620 1250 Figure 24: 1612.5 1627.5 1635 1642.5 1650 1000 1500 1750 2000 2500 3000 3500 4000 -0 0.5 1 Abs 80%\80% 100%\120% 120%\100% 2. 100 50 50 100 0.1334 3. 120 60 50 110 0.1261 S.No. Spike Level (%) Concentration of pure ETV added ( g/mg) Concentration of X-VIR tablet extract added (g/mg) Total Concentration ( g/mg) Peak Area* Concentration 750 101.40 99.88 Recovered (%) 1. 80 40 50 90 0.0975 100.89 Figure 25: | Year 2020 Global Journal of Medical Research ( D D D D ) B Volume XX Issue V Version I | ||
| S.No. | Brand Name | Chemical Name | % Purity* |
| 1. | X-VIR Tablets | Entecavir Monohydrate | 99.75 |
| *Average of 3 determinations | |||
| USP drug content limits for commercially available tablets is 98-102% [33] . | |||
| S.No. | Concentration (µg/ml) | Absorbance *(A) at 257 nm |
| 1. | 15 | 1.904 |
| 2. | 20 | 2.050 |
| 3. | 25 | 2.102 |
| 4. | 30 | 2.238 |
| 5. | 35 | 2.338 |
| 6. | 40 | 2.471 |
| 7. | 45 | 2.605 |
| 8. | 50 | 2.730 |
| S.No. | Parameters | UV -VIS Spectroscopy | Second Derivate FTIR Spectroscopy |
| 1. | Concentration Range | 15-50 µg/ml | 12.5-200 µg/mg |
| 2. | Regression Equation (y = mx + c) | y = 0.0232x + 1.5492 | y = 0.0015x + 0.0387 |
| 3. | Coefficient of Determination (R 2 ) | 0.9942 | 0.9999 |
| 4. | Standard Deviation (STDEV) | 0.285555 | 0.111541 |
| 5. | Standard Error between Y and X (STEYX) | 0.023520 | 0.001457 |
| 6. | Slope (??) | 0.023248 | 0.001463 |
| 7. | Limit of Detection (LOD) | 3.39 µg/ml | 3.29 µg/mg |
| 8. | Limit of Quantitation (LOQ) | 10.12 µg/ml | 9.96 µg/mg |
| c) Assay of ETV on RP-HPLC | |||
| S.No. | Parameters | Conditions |
| 1. | Column | Enable-18H C-18 column |
| 2. | Column Dimensions | 250mm × 4.6mm, 5µm |
| 3. | Mobile Phase | Water:Methanol (80:20) |
| 4. | Flow Rate | 1.2 ml/min |
| 5. | Injection Volume | 20 µL |
| 6. | Wavelength | 254 nm |
| 7. | Runtime | 15 minutes |
| Development |
| Method | Mean of percentage purity | Standard deviation of individual data | Size of sample |
| Second Derivative FTIR | ??? 1 = 99.75 | ?? 1 2 = 0.808 | ?? 1 = 3 |
| RP-HPLC | ??? 2 = 90.04 | ?? 2 2 = 4.595 | ?? 2 = 3 |
| Hypothesis: The two analytical methods, to determine | |||
| the percentage purity of Entecavir monohydrate, are not | |||
| significantly different. | |||