1. Introduction
ound is a form of energy and (Suter, 1991) rightly describes it as "the result of pressure changes in a medium (usually air), caused by vibration or turbulence." The human ear captures sound within a specific window of the acoustic spectrum, generally within the 20-20000 Hz range. However, it is most responsive to sounds within the mid-frequencies: 1000-10000 Hz (Mariana Alves-Pereira & Castelo Branco, 2000). (Cantrell, 1975) defined noise as sound which is disagreeable, discordant, or which interferes with the reception of wanted sounds. There are many sounds in the world, but not all of them pollute the environment and hence are not regarded as noise (Kryter, 1982). Medically speaking, noise is one of the leading causes of environmental stress and low-frequency noise is equally as stressful as high-frequency noise (Cho, Hwang, & Choi, 2011). One of the challenges in studying and managing noise is its subjective nature: one person's noise is another's music. People have widely varying reactions to noise. Individual reactions depend on characteristics of the noise, the noise source, and the individual's attitude to the noise and noise source.
Noise is classified based on its nature into two categories namely: broadband noise and tonal noise. Noise can be said to be tonal if it contains a distinguishable, discrete, continuous note (Greene, Manvell, Scholz, & Enggaard, 2008). Broadband noise has acoustic energy spread out across a wide range of frequencies, whereas a tonal noise has a lot of energy concentrated at certain frequencies -resulting in an audible tone or tones. Tonal noise tends to be more annoying or disturbing and so having the ability to detect and record tones can be very useful.
Noise is usually composed of many frequencies combined (Goelzer, Hansen, & Sehrndt, 2001). To facilitate the comparison of measurements between instruments, frequency analysis bands have been standardized. Thus, the International Organization for Standardization has agreed upon preferred frequency bands for sound measurement and analysis. The widest band used for frequency analysis is the octave band. Occasionally, a little more information about the detailed structure of the noise may be required than the octave band will provide. This can be obtained by selecting narrower bands; for example, one-third octave bands. As the name suggests, these are bands of the frequency of approximately one-third of the width of an octave band.
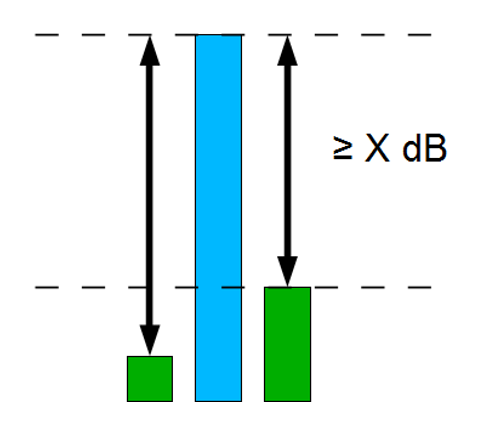
Nowadays, sound level meters that can detect tonal noise directly are available in the market, but they are very expensive and beyond the reach of most environmental noise researchers. Hence, the need to adopt an analytical method that can be used to analyse and detect the presence of pure tones in helicopter noise. This paper will employ the simplified method suggested by the International Organization for Standardization (ISO). This method tests if the sound pressure level in the one-third octave band of interest exceeds the sound pressure in both adjacent bands by a constant level difference. It is also an extension of previous studies by the current authors (O. Orikpete, Leton, & Momoh, 2020; O. F. Orikpete, Leton, Amah, & Ewim, 2020). S (Edwards, Broderson, Barbour, McCoy, & Johnson, 1979) conducted a study on behalf of the Federal Aviation Administration (FAA) which involved taking field measurements of helicopter flyover noise over communities along the Gulf Coast of Louisiana and Texas and areas adjacent to selected heliports in the United States using two analyzers. One of the analyzers measured the prevailing environmental noise (including helicopter noise), while the other recorded the prevailing environmental noise (excluding helicopter noise). The study also used a social survey to support quantitative measurements by obtaining 272 questionnaire responses from stakeholders. The outcome of the study revealed an average equivalent continuous noise level of 54.5 dB (A) for helicopter flyover noise, a value which exceeded the background noise by 2.5 dB(A); and 63.1 dB(A) for areas adjacent to heliports, which was 13.3 dB(A) above the heliport background noise. Although the results for the social survey showed that 64% of respondents had no problem with helicopter noise, the actual health implications of helicopter noise on residents living within the study area cannot be fully ascertained without a one-third octave frequency band analysis.
Noise of the same intensity will produce different hearing impairment depending on the frequency. In his book, (Yost, 2001) explained that the actual pressure transformation in the human ear depends on the frequency of the acoustic stimulus; pointing out that the pressure increase between the eardrum and the inner ear is greater than 30 dB in the region of 2.5 kHz and that the ratio decreases at frequencies exceeding 2.5 kHz. He further elaborated that hearing impairment depends on the characteristics of the noise that an individual is exposed to, most particularly, the frequency of the noise. In summary, temporary hearing loss will occur when one is exposed to broadband noise at frequencies between 3 and 6 kHz; whereas exposure to a pure tone at frequencies greater than 6 kHz, is likely to result in more severe hearing loss.
Laboratory studies carried out by (Landström, Lundström, & Byström, 1983) as reported by (Leventhall, Pelmear, & Benton, 2003) revealed that a repeating 42 Hz noise at 70 dB resulted in reduced wakefulness, whereas a repeating 1 kHz noise at 30dB resulted in increased wakefulness. (Phillips, 1995) observed that the central auditory system of the human body is built on frequency-specific processing channels hence assessment and characterization of an acoustic environment would require both the dB level and the frequency distribution considerations. (Mariana Alves-Pereira & Castelo Branco, 2000) shared the same opinion and reiterated that a holistic study of assessment of noise effects should consist of data of both intensity and frequency spectrum analysis because different organ systems are susceptible to different acoustic frequencies.
(M Alves-Pereira, 1999) also observed that with very few exceptions, environmental noise assessments rarely included a frequency spectra analysis. The study went further to note that scientific investigations into the extra-aural, whole-body, noise-induced pathology issue have been infrequent since the previous decades and that existing data are often regarded as inconclusive.
(Prashanth & Venugopalachar, 2011) investigated the association and contribution of frequency components of industrial noise to auditory and non-auditory effects through a critical review of previous studies published between 1998 and 2009 and found out that most of these noise impact assessment studies were mostly based on inadequate noise intensity. The authors further suggested that for an efficient evaluation of the effects of noise, the frequency spectrum analysis should also be included. They also observed that frequency-related characteristics of noise, for instance intermittent, irregular, tonal, pulse, etc. generated more annoyance than steady noise of the same intensity.
In research by (Helmholtz, 1954) on tone sensation, he stated that the first and most important difference between various sounds experienced by our ear is that between "noises" and "musical tones", based on this, (Hansen, 2010) went further to examine the various aspects of the tone-noise dichotomy -the magnitude of tonal content and the pitch strength. He discovered that partial loudness was far easier and more intuitive to adjust in a magnitude adjustment experiment than the magnitude of tonal content. (Leatherwood, 1987) addressed the effects of simulated advanced turboprop (ATP) interior noise environments with tonal beats on subjective annoyance. He observed that propeller tones within the simulated (ATP) environments caused an increased annoyance as a result of an increase in overall sound pressure level due to tones.
Also, a study by (Suzuki, Kono, & Sone, 1988)on the effect of tonal components on loudness and noisiness of wide-band noise was observed to be less than what was estimated by L A , LL(Z), PLdB, and PNdB. It was observed that Zwicker's Loudness Level competently evaluates the effect of the test stimuli used. He concluded by stating that conventional positive tone correction is not always required in the evaluation of environmental noise.
In a research by (Angerer, McCurdy, & Erickson, 1991), it was discovered that a model has a distinct effect on tonal-noise perception. (Mirowska, 2001) presented a Polish recommendation for the estimation of low-frequency noise (LFN) in homes as a result of appliances installed within or outside the building. Using the accepted A10 characteristic rating curve for noise spectra measurement in dwellings, he observed that when the sound pressure levels of noise exceeded the A10 curve, low-frequency noise was observed to be annoying. Similarly, (Pawlaczyk-?uszczy?ska, Szymczak, Dudarewicz, & ?liwi?ska-Kowalska, 2006) researched ways to compute low-frequency noise (LFN) in the working environment to prevent annoyance and its consequences on work performance. All proposed LFN exposure criteria: the assessment method based on the low frequency equivalent continuous A-weighted sound SPL, frequency analysis in 1/3-octave bands and the criterion curves based on the hearing threshold level or A-weighting characteristics was able to predict annoyance experienced from LFN in occupational settings.
Several investigations have also specifically focused on the effects of aircraft noise on human annoyance rating and performance. As discovered by (More & Davies, 2010) from the test conducted on the effect of noise characteristics on people's response to aircraft noise; an increase in annoyance rating was observed when both tonalness and roughness were varied with loudness being kept constant. Loudness was found to be the major contributor to annoyance while tonalness and roughness also influenced the annoyance ratings. In another study (Li, Smith, & Zhang, 2010) made use of a one-quarter-scale A340 main landing gear model to identify and control a source of tonal-noise that had been noted in aircraft landing gear noise during the landing process of an aircraft. Several methods were used to control the tone, the most practical of which was either rotation of the hinged door, so that it was no longer parallel to the leg door, or complete removal of the hinged door. Also, a new signal processing tool for counter-rotating open rotors technology for aircraft propulsion applications was developed by (Sree, 2013). It was verified that the new technique provides almost the same results whether the data segment selection is made with respect to the for ward rotor or aft rotor "1/rev" signal, particularly when the two rotor speeds are about the same.
Also, mechanical buildings and the effect of noises generated from rotating components on humans have been understudied. Most of these studies examined human perception of noise, one of which was the study on differences in task performance and perception under ventilation-type background noise spectra with differing tonality by (Ryherd & Wang, 2008). The result showed that perception trends for tonality, annoyance, and distraction changes based on the frequency and prominence of discrete tones in noise. Furthermore (Ryherd & Wang, 2010) examined the effects of noise on human task performance and perception from mechanical systems in buildings with tonal components using an office-like environment. Higher ratings of loudness followed by roar, rumble, tones, and perception of more low-frequency rumble were noticed to cause higher annoyance and distraction which led to reduced task performance. In a similar study by (Francis, 2014) in an investigation on annoyance thresholds, the background noise level was found out to affect perceptions of annoyance. Also (Lee & Wang, 2014) discovered that loudness and tonality both have a significant influence on noise-induced annoyance and also that maximum allowable tonal components decrease when the background noise level is high. They went further to state that ANSI Loudness Level and Tonal Audibility are the most reliable metrics to reflect human annoyance perception.
(Lee, Francis, & Wang, 2017) studied the relationship between human perception and noises with tones in the built environment. Correlation analysis with noise metrics and subjective perception ratings suggested that ANSI Loudness Level among the tested loudness metrics corresponded most strongly with annoyance perception. In a review by (Hansen, Verhey, & Weber, 2011) it was reported that high correlation of the magnitude of tonal content and partial loudness indicates that the magnitude of strong tonal components may be assessed by quantifying the partial loudness of the tonal components. ( (White, Bronkhorst, & Meeter, 2017) sought to find out if the continuous rating of aircraft noise above noises from other sources with similar intensity is due to the source identity of the noise. He concluded that annoyance was influenced by both identifiability and the presence of tonal components.
(Oliva, Hongisto, & Haapakangas, 2017) researched on the difference in tonal and non-tonal sounds at overall levels close to typical regulated levels inside residential dwellings. It was observed that penalty depended on the tonal frequency and the tonal audibility. Also, penalty values were different with different overall levels especially at high tonal performance under assorted tonal noise conditions through subjective testing. The task performance showed that loudness metrics are most highly correlated with annoyance responses while tonality metrics demonstrate relatively less but also significant correlation with annoyance.
A study by (Hajczak, Sanders, & Druault, 2019) focused on the boundary element method (BEM) with a simple harmonic point source model used to characterize the resonance between the two facing cylindrical cavities in the wheels of a generic nose landing gear LAGOON, where a flow independent of tonal noise emission had been reported experimentally. It was observed that the facing cavities present much sharper resonances than the single cavity, and that the presence of the main strut only increased the amplification of the axisymmetric mode.
Recently, (Radosz, 2018) observed that noise with medium and high frequencies of tonal components were regarded as more annoying in an experiment carried out on the relationship between human perception and noise with tonal components in a working environment. (Torjussen, 2019) observed that the Aures tonality method outperforms the EPNL tone correction approach when assessing the subjective response to aircraft noise during take-off with the presence of multiple complex tones. A research by (Wallner, Hutter, & Moshammer, 2019) showed that a scientific approach within a complex environmental noise problem could foster an agreement about noise protection measures. Measurements were taken from 7 am to 5 pm at each location using two integrating sound analyzers; one measured the sound level including the contribution from helicopters and the other the sound level excluding that from helicopters (this was switched to IDLE mode any time a helicopter was audible). Location coordinates were obtained using a handheld Global Positioning System (GPS) device.
2. III.
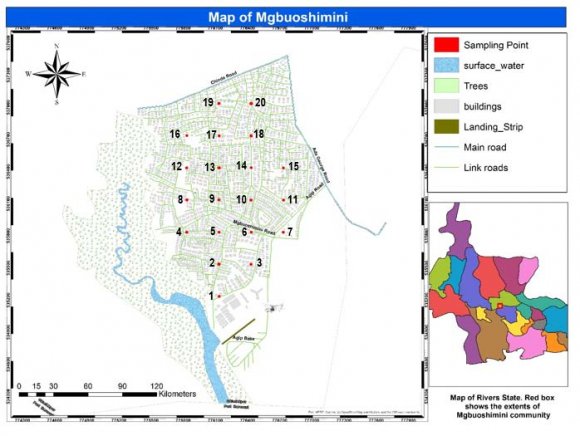
3. Study Area
4. b) Tonal Noise Detection Method
(ISO, 2003) provides objective one-third octave band assessment procedure (shown in Figure 2) to be used to verify the presence of audible tones if their presence is in dispute. This method is based on onethird octave analysis. The one-third octave spectrum is searched for peaks and the search criterion is the level difference between a peak and its adjacent bands. When this difference reaches a certain frequency dependent level a tone is found. The standard defines different levels of threshold depending upon the frequency of the one-third octave band and these are: An examination of Fig. 36 above shows protruding bands at the 8 th and 16 th positions counting from the left and this corresponds to the 63 Hz and 400 Hz one-third octave bands respectively. Referring to An examination of Fig. 37 above shows protruding bands at the 8 th , 24 th and 28 th positions counting from the left and this corresponds to the 63 Hz, 2.5 kHz and 6.3 kHz one-third octave bands respectively. Referring to
5. Results and Discussion
6. Location 17
An examination of Fig. 38 above shows protruding bands at the 8 th , 16 th , 19 th , and 28 th positions counting from the left and this corresponds to the 63 Hz, 400 Hz, 800 Hz, and 6.3 kHz one-third octave bands respectively. Referring to An examination of Fig. 39 above shows protruding bands at the 6 th , 8 th , 16 th , and 28 th positions counting from the left and this corresponds to the 40 Hz, 63 Hz, 400 Hz, and 6.3 kHz one-third octave bands respectively. Referring to Table 2, we subtract the noise level values (at 40 Hz, 63 Hz, 400 Hz, and 6.3 kHz) from their immediate adjacent bands right and left to see if they meet the criteria of being 'tones'. At 40 Hz,
7. Location 19
An examination of Fig. 40 above shows protruding bands at the 8 th , 11 th , 13 th , 16 th , and 28 th positions counting from the left and this corresponds to the 63 Hz, 125 Hz, 200 Hz, 400 Hz and 6.3 kHz one-third octave bands respectively. Referring to
8. Location 20
An examination of Fig. 41 above shows protruding bands at the 8 th and 28 th positions counting from the left and this corresponds to the 63 Hz and 6.3 kHz one-third octave bands respectively. Referring to Table 2, we subtract the noise level values (at 63 Hz and 6.3 kHz) from their immediate adjacent bands right and left to see if they meet the criteria of being 'tones'.
At 63 Hz,
9. VI. Conclusion and Recommendations
A one-third octave band frequency analysis was conducted at each noise measurement locations in order to assess any tonal component associated with helicopter flyover activity. Analysis of the one-third octave band frequency spectra measured at each of the noise monitoring locations from 7 am to 5 pm are presented in Tables 23-41. The frequency spectra showed that the helicopter noise contains tonal noise at locations 7 (at 400 Hz), 18 (at 6.3 kHz), 19 (at 6.3 kHz), and 20 (at 6.3 kHz)
From an examination of the one-third octave band frequency spectra, it is noted that spectra measured at all locations are generally broadband except for locations 7, 18, 19, and 20 which have pure tones in line with the ISO 1996-2 criteria. Tonal noise was mostly observed at the high frequency range at 6.3 kHz.
It can therefore be concluded that there is significant tonal content associated with helicopter flyover noise at locations 7, 18, 19, and 20 and therefore residents in these locations will experience higher level of annoyance and daytime sleep disturbance associated with tonal noise.
The results of the study clearly indicate that helicopter flyover noise generates tonal noise across a section of Mgbuoshimini community and this could produce increased annoyance and day-time sleep disturbance.
It is also clear from the results of this study that heliport is sited too close to the community and is operating outside the limits set out in ISO 1996ISO -2:2007. .
| Noise) |
| Noise)?Continue |
| Assessment of Helicopter Flyover Noise for Tonal Components Assessment of Helicopter Flyover Noise for Tonal Components Assessment of Helicopter Flyover Noise for Tonal Components | |||||||||||||||||||||
| 70.00 80.00 50.00 60.00 | TOTAL Leq TOTAL Leq | ||||||||||||||||||||
| 60.00 60.00 40.00 70.00 | |||||||||||||||||||||
| 50.00 30.00 50.00 | |||||||||||||||||||||
| 00 10.00 10.00 20.00 30.00 40.00 40.00 20.00 30.00 | TOTAL Leq TOTAL Leq | ||||||||||||||||||||
| Year 2020 | 0.00 0.00 | Leq Leq | 16 16 | 25 25 | 40 40 | 63 63 | 100 100 | 160 160 | 250 250 | 400 400 | 630 630 | 1k 1k | 1.6k 1.6k | 2.5k 2.5k | 4k 4k | 6.3k 6.3k | 10k 10k | 16k 16k | Year 2020 Year 2020 | ||
| 40 | Figure 9: One-third octave frequency band at Location 7 | 39 41 | |||||||||||||||||||
| Volume XX Issue XI Version I | 30.00 40.00 50.00 60.00 70.00 20.00 30.00 40.00 50.00 60.00 70.00 20.00 30.00 40.00 50.00 60.00 70.00 80.00 | TOTAL Leq | TOTAL Leq | Volume XX Issue XI Version I Volume XX Issue XI Version I | |||||||||||||||||
| ( D D D D ) | 10.00 20.00 10.00 10.00 | ( ( D D D D ) D D D D ) | |||||||||||||||||||
| Global Journal of Medical Research | 0.00 40.00 50.00 60.00 70.00 80.00 0.00 30.00 40.00 50.00 60.00 40.00 50.00 60.00 70.00 70.00 0.00 | Leq | 16 | 25 | 40 | 63 | 100 | 160 | 250 TOTAL Leq 400 630 1k 1.6k 2.5k TOTAL Leq | 4k | 6.3k | 10k | 16k | Series1 | Global Journal of Medical Research Global Journal of Medical Research | ||||||
| 10.00 10.00 10.00 20.00 20.00 30.00 20.00 30.00 | TOTAL Leq TOTAL Leq | ||||||||||||||||||||
| 0.00 0.00 0.00 | Leq Leq Leq | 16 16 16 | 25 25 25 | 40 40 40 | 63 63 63 | 100 100 100 | 160 160 250 250 400 400 630 630 1k 1k 1.6k 1.6k 2.5k 160 250 400 630 1k 1.6k 2.5k | 4k 2.5k 4k | 6.3k 4k 6.3k | 10k 6.3k 10k | 16k 10k 16k | 16k | |||||||||
| Assessment of Helicopter Flyover Noise for Tonal Components | |||||||||||||||||||||
| Location Leq 12.5Hz 16Hz 20Hz 50Hz 63Hz 80Hz 100Hz 125Hz 160Hz 200Hz 250Hz 315Hz 400Hz 25Hz 31.5Hz 40Hz | 1 80.20 15.50 52.77 56.46 53.21 56.48 60.00 63.91 8.50 11.60 21.03 42.92 43.13 39.52 44.28 48.91 27.46 | 2 72.87 9.84 50.44 54.65 53.88 54.53 56.04 59.44 17.03 19.83 18.29 38.04 41.34 41.49 48.19 45.52 31.63 | 3 73.74 4.32 51.99 52.38 55.26 57.91 60.23 61.70 5.35 29.50 19.01 36.40 32.62 41.83 46.69 48.07 23.92 | 4 72.60 3.16 48.65 46.84 49.51 53.04 56.38 59.74 8.47 20.69 23.52 33.66 39.91 49.16 40.36 42.70 29.69 | 5 75.47 4.11 59.99 56.71 59.53 62.46 65.58 69.22 7.82 37.85 33.86 43.25 38.18 49.72 47.76 54.57 30.89 | 6 75.23 4.97 57.25 62.18 64.31 66.17 65.77 65.14 6.47 27.84 25.71 34.12 37.65 41.30 45.00 51.49 28.19 | 7 71.26 3.83 48.66 54.35 50.14 63.43 47.64 48.26 0.93 25.67 21.08 22.32 32.18 38.79 42.88 38.63 24.00 | 8 70.51 2.67 45.44 44.37 48.47 51.65 54.56 56.62 5.31 16.32 22.19 33.55 38.78 49.07 38.59 40.61 28.38 | 9 70.37 4.38 54.51 52.83 57.75 59.30 65.44 66.43 7.29 36.91 33.90 41.99 33.59 48.22 45.58 50.87 28.63 | 10 75.85 3.55 56.40 61.90 62.89 66.17 64.81 63.35 5.82 26.48 24.91 33.92 37.74 41.57 44.15 47.28 27.69 | 11 72.95 1.72 53.89 57.97 61.15 64.04 61.29 62.75 3.53 20.59 23.49 28.20 34.14 37.26 41.36 46.74 24.46 | 12 68.28 2.18 53.87 46.59 54.00 56.56 58.69 66.19 2.53 28.80 28.88 37.79 29.99 44.77 32.04 45.69 21.41 | 13 68.79 4.27 54.90 51.74 57.71 58.02 63.19 66.39 6.89 31.18 33.38 37.38 33.98 47.84 40.40 50.27 25.46 | 14 67.95 1.16 51.67 50.99 56.69 56.44 62.50 62.18 4.95 28.78 28.75 32.87 31.08 43.29 32.44 47.64 21.74 | 15 67.47 3.03 49.40 49.32 57.33 55.16 58.82 65.28 1.56 27.98 33.53 33.65 31.04 44.09 33.69 47.69 25.99 | 16 67.81 0.87 49.43 46.93 48.49 53.47 53.59 66.36 2.25 26.58 28.27 34.40 28.09 42.18 26.87 42.45 18.39 | 17 67.90 2.75 50.90 48.88 57.10 53.26 58.73 66.75 1.64 30.86 30.71 37.99 32.99 44.51 35.77 46.14 25.94 | 18 67.43 1.27 45.03 48.72 52.58 51.79 54.58 62.85 1.58 29.84 28.88 34.25 27.18 43.21 31.08 41.63 21.51 | 19 67.64 1.16 50.91 44.32 56.76 51.81 56.30 64.15 0.69 30.82 26.37 36.45 33.03 40.38 30.62 44.55 23.30 | 20 67.32 2.19 45.27 46.20 52.90 53.30 55.83 62.77 0.73 27.68 26.02 32.41 31.96 41.32 30.31 43.77 20.23 | Global Journal of Year 2020 45 Medical Research Volume XX Issue XI Version I ( D D D D ) |
| At 250 Hz, |
| 63.43 -47.64 = 15.79 dB? 8 dB |
| 63.43 -50.14 = 13.29 dB? 8 dB |
| Hence, there is tonal noise at 250 Hz |
| At 63 Hz, |
| 49.07 -38.59 = 10.48 dB ? 15 dB |
| 49.07 -38.78 = 10.29 dB ? 15 dB |
| Hence, there is no tonal noise. |
| At 40 Hz, |
| 41.99 -33.59 = 8.4 dB ? 15 dB |
| 41.99 -28.63 = 13.36 dB ? 15 dB |
| Hence, there is no tonal noise. |
| 44.77 -29.99 = 14.78 dB ? 15 dB |
| At 125 Hz, |
| 53.87 -46.59 = 7.28 dB ? 15 dB |
| 53.87 -45.69 = 8.18 dB ? 15 dB |
| Hence, there is no tonal noise. |
| At 63 Hz, |
| 44.77 -32.04 = 12.73 dB ? 15 dB |
| At 63 Hz, |
| 43.29 -32.44 = 10.85 dB ? 15 dB |
| 43.29 -31.08 = 12.21 dB ? 15 dB |
| Hence, there is no tonal noise. |
| At 63 Hz, |
| 44.09 -33.69 = 10.40 dB ? 15 dB |
| 44.09 -31.04 = 13.05 dB ? 15 dB |
| At 400 Hz, |
| 65.28 -60.45 = 4.83 dB ? 8 dB |
| 65.28 -58.82 = 6.46 dB ? 8 dB |
| At 63 Hz, |
| 42.18 -26.87 = 15.31 dB ? 15 dB |
| 42.18 -28.09 = 14.09 dB ? 15 dB |
| At 2.5 kHz, |
| 55.17 -50.41 = 4.76 dB ? 6 dB |
| 55.17 -49.72 = 5.45 dB ? 6 dB |
| 44.51 -32.99 = 11.52 dB ? 15 dB | |
| At 400 Hz, | |
| 66.75 -59.62 = 7.13 dB ? 8 dB | |
| 66.75 -58.73 = 8.02 dB ? 8 dB | |
| At 800 Hz, | |
| 62.39 -58.38 = 4.01 dB ? 6 dB | |
| 62.39 -56.72 = 5.67 dB ? 6 dB | |
| At 6.3 kHz, | |
| 51.16 -40.62 = 10.54 dB ? 6 dB | |
| At 63 Hz, | 51.16 -47.26 = 3.90 dB ? 6 dB |
| 44.51 -35.77 = 8.74 dB ? 15 dB | |
| Hence, there is no tonal noise. |
| Assessment of Helicopter Flyover Noise for Tonal Components | ||
| Year 2020 | 70.00 | |
| 56 | 60.00 | |
| Volume XX Issue XI Version I | 0.00 10.00 20.00 30.00 40.00 50.00 | |
| D D D D ) | ||
| ( | ||
| Global Journal of Medical Research | At 63 Hz, 40.38 -30.62 = 9.76 dB ? 15 dB | At 400 Hz, 64.15 -55.58 = 8.57 dB ? 8 dB 64.15 -56.30= 7.85 dB ? 8 dB At 6.3 kHz, 50.51 -44.07 = 6.44 dB ? 6 dB 50.51 -37.56 = 12.95 dB ? 6 dB |
| 40.38 -33.03 = 7.35 dB ? 15 dB | ||
| At 125 Hz, | ||
| 50.91 -44.32 = 6.59 dB ? 15 dB | ||
| 50.91 -44.55 = 6.36 dB ? 15 dB | ||
| At 200 Hz, | ||
| 56.76 -51.81 = 4.95 dB ? 8 dB | ||
| 56.76 -44.32 = 12.44 dB ? 8 dB | ||