1.
Optimizing the Combination of Different Pulsed Nd: YAG Laser Beam Welding Process Parameters to Attain Minimum HAZ for Thin Cp.Ti with Ti-6Al-7Nb Sheets using Response Surface Methodology (RSM) Method
2. Weaam Mohammed Moslim
Author: College of Materials Engineering, University of Babylon, Iraq. e-mail: [email protected] Laser-beam welding has been emonstrated to be an effective technique for dental laboratory work [2,3]. In general, laser welding has some advantages compared with conventional dental soldering:
1. With the use of laser welding, it is easier and more simple to connect dental alloys because no further materials, such as investment or gas torches, are needed, and welding can be performed directly on the model [4,5]. 2. Laser-welded pieces may have higher corrosion resistance because laser welding can weld parent metals without solder or with solder consisting of the same metal. 3. Because laser energy can be concentrated in small area, there is a smaller heat-affected zone. 4. Oxidation on the area surrounding the spot is minimal, because laser welding is performed in argon atmosphere.
Laser welding might be suitable for joining dental prostheses made of titanium because of its high reactivity to oxygen at high temperature [6][7][8].
Pulsed Nd: YAG laser welding is one of the few techniques suitable for joining thin sheet metals. Small heat affected zone (HAZ), low heat input periuniti volume, high degree of automation and high welding speed are the merits of laser welding technology [9]. Titanium alloys can be welded using a pulsed mode laser. In pulsed laser applications, a small molten pool is formed by each laser pulse and within a few milliseconds it resolidifies [10]. But the control of the Nd: YAG laser welding parameters to attain small HAZ in the CP. Ti and/or Ti6Al7Nb welding process remain huge
I.Introductioni n the recent decade, commercially pure titanium (CP Ti) and titanium alloys have expanded in their range of dental applications-dental implants, crowns, and fixed/removable partial dentures, due to its superior biocompatibility. However, disadvantages of CP. Ti have also been pointed out, such as lake of mechanical strength for some dental applications and poor wear resistance. There is also a concern about the cytotoxicity of vanadium in Ti6Al-4V alloy, With high mechanical properties and biocompatibility, Ti-6AI-7Nb alloy was consequently introduced to be an alternative to CP.Ti or Ti-6Al-4V alloy as a dental casting alloy.
Soldering is a common method that joins dental alloy prostheses for clinical use although the corrosion resistance of the soldered materials is a concern. However, soldering is not suitable for joining CP.Ti or titanium alloys because of the decrease in corrosion resistance and biocompatibility due to the contact of different types of metal. Other methods for joining CP.Ti or titanium alloys have been introduced, such as plasma welding, tungsten inert gas (TIG) welding and infrared brazing, but the disadvantage of large heat affected zone created by plasma welding, TIG and infrared brazing was also reported, In addition, I these methods require filler metals that could potentially reduce corrosion resistance. Against these disadvantages, laser welding has become a preferred method to join metals in dentistry, especially for CP. Ti and titanium alloys. As most of the studies focused mainly on CP. Ti, laser welding on titanium alloys, especially Ti-6Al-7Nb alloy, has not yet been sufficiently investigated [1].
problem in relation to their microstructure. Depending on the method, the weld could result in a very narrow or fairly wide fusion zone (FZ) and heat affected zone (HAZ) due to the heat input experienced by the work piece [11].
3. II.
4. Materials and Methods
Experimental was carried out on commercial purity titanium (Ti) and Ti-6Al-7Nb with 100 × 50 mm and 1.5 mm thickness. The major chemical composition and mechanical/physical properties of this alloys are listed in Table 1. In the present investigation, all the experiments were performed on Pulse Nd-YAG laser welding as a source of laser (model Haas HL3006D), accompanied with high speed imaging (HIS), this laser is able to radiate a continuous wave mode (this mode was actually used in the experiments) with upto 3KW and predetermined were recorded using a high speed imaging system. Fig. 1 is how the employed laser system. A coaxial nozzle is used purging pure argon gas (purity 99.998) with the laser beam. The pulsed Nd: YAG laser has adjustable pulse shape which offers high flexibility in optimizing the weld parameters to achieve defect free joints.
5. Response Surface Methodology
Response surface methodology(RSM) is a combination of mathematical, statistical method and it can be used to develop the regression model and optimization of engineering problems [12]. It is one of the design of experiments method used to approximate an unknown function for which only a few values are computed. These relations are then modeled by using least square error fitting of the response surface. A Central Composite Design (CCD) is used since it gives a comparatively accurate prediction of all response variable averages related to quantities measured during experimentation [13]. CCD offers the advantage that certain level adjustments are acceptable and can be applied in the two-step chronological RSM. In these methods, there is a possibility that the experiments will stop with a few runs and decide that the prediction model is satisfactory. In CCD, the limits of the experimental domain to be explored are defined and are made as wide as possible to obtain a clear response from the model. The WP, PE, Ton, and WS are the welding variables selected for this investigation. The different levels taken for this study are depicted in Table
2 Year 2020 Global Journal of Medical Research Volume XX Issue XIV Version I ( D D D D ) K 2.The arrangement to conduct the experiments using a CCD with four variables, the cardinal points used are sixteen cube points, eight axial points and six center point, in total of 30 runs in three blocks [14]. The values of DOP and BW are shown in Table 3. The second order model is normally used when the response function is not known or nonlinear. In the present study, a second order model has been utilize. The experimental values are analyzed and the mathematical model is then developed that illustrate the relationship between the process variable and response. The second order model in equation ( 1) explains the behavior of the system [15].
Yi = b oi + ? b i k i=1 x i i + ? b ii x i 2 k i=1 i + ? b ij x i x j ± ? 2 i<j=2 i ? ? ? ? ? ? ? ? (1)Where Y is the corresponding response, X i is the input variables, X² ii and X i X j are the squares and interaction terms, respectively, of these input variables. The unknown regression coefficients are ? o , ? i , ? ij and ? ii and the error in the model is depicted as ?. A: C.P Ti B: Ti-6Al-7Nbi AA: C.P Ti + C.P Ti (similar) BB: Ti-6Al-7Nb + Ti-6Al-7Nb (similar) AB: C.P Ti+ Ti-6Al-7Nb (dissimilar)
Table 3: Design layout & experimental results (CCD) Runi Orderi Pti Typei Blocksi WPi --- PEi Ji Toni µseci. WSi mmi/s HAZi µmi 1i 1i 1i -1i -1i -1i 1i 2893i 2i 1i 1i 1i -1i -1i -1i 1377i 3i 1i 1i -1i -1i 1i -1i 3472i 4i 1i 1i -1i 1i -1i -1i 3568i 5i 1i 1i 1i 1i -1i 1i 1653i 6i 0i 1i 1i -1i 1i 1i 1488i 7i 1i 1i 0i 0i 0i 0i 2382i 8i 0i 1i 0i 0i 0i 0i 2379i 9i 1i 1i -1i 1i 1i 1i 3468i 10i 1i 1i 1i 1i 1i -1i 1835i 11i 0i 2i 0i -1i 0i 0i 2268i 12i 1i 2i 0i 0i 0i 0i 2382i 13i 1i 2i 0i 0i 0i 1i 2257i 14i 0i 2i 0i 0i 0i -1i 2507i 15i 1i 2i 0i 0i -1i 0i 2290i Table 3: Design layout & experimental results (CCD) (Contd.) Runi Orderi Pti Typei Blocksi WPi --- PEi Ji Toni µseci. WSi mmi/s HAZi µmi 16i 1i 2i 1i 0i 0i 0i 1588i 17i 1i 2i -1i 0i 0i 0i 3335i 18i 1i 2i 0i 0i 1i 0i 2474i 19i 1i 2i 0i 0i 0i 0i 2380i 20i 1i 2i 0i 1i 0i 0i 2518i 21i 0i 3i -1i 1i -1i 1i 3211i 22i -1i 3i -1i -1i 1i 1i 3125i 23i -1i 3i 0i 0i 0i 0i 2378i 24i 0i 3i -1i -1i -1i -1i 3215i 25i -1i 3i -1i 1i 1i -1i 3854i 26i -1i 3i 1i -1i 1i -1i 1653i 27i -1i 3i 1i 1i 1i 1i 1651i 28i -1i 3i 1i 1i -1i -1i 1837i 29i -1i 3i 1i -1i -1i 1i 1377i 30i -1i 3i 0i 0i 0i 0i 2384i PtTypei1 indicatesiaicubeipointiof itheidesigni; PtTypei0 indicatesiaicenter pointi; PtType -1 indicatesi aniaxial pointi;The unknown coefficients are determined from the experimental data as presented in Table 4. The standard errors in the estimation of the coefficients are tabulated in the column ?SE cofi.?. The F ratios are calculated for 95% level of confidence and the factors having p value more than 0.05 are considered in significant (shown with * in p column). For the appropriate fitting of HAZ, the non significant terms are eliminated by the backward elimination process. The regression model is re evaluated by determining the unknown coefficients, which are tabulated in Table 5. The model made to represent HAZ depicts that the pure quadratic effect of workpiece type (WP2) as well as the two way interactions of workpiece type with pulse energy (WP×PE), workpiece type with pulse duration (WP×Ton), workpiece type with welding speed (WP× WS) pulse energy with pulse-on time (PE×Ton) and pulse energy with pulse duration (PE×Ton) were also found to be extremely important terms influencing HAZ. The final response equations for HAZ are given in equations( 2 Since, YAG laser welding process is non linear in nature, a linear polynomial will be not able to predict the response accurately, and therefore the second order model (quadratic model) is found to be adequately modeled the process. The ANOVA table for the curtailed quadratic model Table 6, depicts the value of the coefficient of determination, R² as 99.93% and 99.96%, which signifies that how much variation in the response is explained by the model. The higher of R², indicates the best fitting of the model with the data. The model adequacy checking includes the test for significance of the regression model, model coefficients, and lack of fit, which is carried out subsequently using ANOVA on the curtailed model Table 6. The total error of regression is the sum of errors in linear, square, and interaction terms. Table 7 presents the Nd: YAG Laser welding parameters for each run order, along with the experimental results (expt.), the predicted response (Pred.) and the residues (Res.). Where the residues are the difference between the experimentally observed data and the model predictions. The predicted values of HAZ achieved using Equation 4. 4 is close to the experimental values confirming the sufficiency of the model and the residues are further analyzed in the following section.
A complete residual analysis has also been done for every developed response and the graph is shown in Fig. 2. The normal probability plot is a graphical technique for evaluating whether a data set is approximately normally distributed. Normal probability plot of residual reveals that experimental data are spread approximately along a straight line, confirming a good correlation between experimental and predicted values for the response (Fig. 2(a)) In graph of residual versus fitted values(Fig. 2(b)) only small variation can be seen. The histogram of residuals (Fig. 2(c)) also show Gaussian distribution which is desirable, and finally, in residual against the order of experimentationsv in Fig. 2(d) both negative and positive residual are apparent indicating no special trend which is worthy from statistical point of view. As a whole, all the yielded models do not show any inadequacy. Result and Discussioni Fig. 3, depicts the main effect plots of the four controllable parameters on HAZ. It is understandable that all variables have more influential impacts on HAZ. The results in the Table 6 support this. Fig. 3: Main Effect Plots for HAZ More specifically, transforming the WP alone from C.P. Ti to Ti-6Al-7Nb, while keeping the other factors constant at their middle levels, can decrease HAZ by110 % (from 3335 ?m to 1588?m), which is a higher difference interval than those created by other parameters. This is probably because C.P. Ti has more thermal conductivity than Ti-6Al-7Nb. The heat input is directly related to the average laser power, the welding speed and welding efficiency. It can be calculated directly from [16]: Heatiinputi=(ALPi/WSi)×?..?????????... (3) Where, (ALP) is average laser power, WS welding speed and ? is the welding efficiency. According to above, it is evident that the HAZ increase when the PE increases and (WS) decreases, HAZ increases by 11% (from 2268 ?m to 2518?m), with PE increases (from 9 J to 15 J) and HAZ decreases by 10% (from 2507 ?m to 2257?m), with WS increases (from 3 mm/sec to 7 mm/sec), When the pulse duration increases, the heat input also increases and the HZA increases, HAZ increases by 8 % (from 2290 ?m to 2474 ?m), with Ton increases (from 4 ?sec to 8 ?sec).
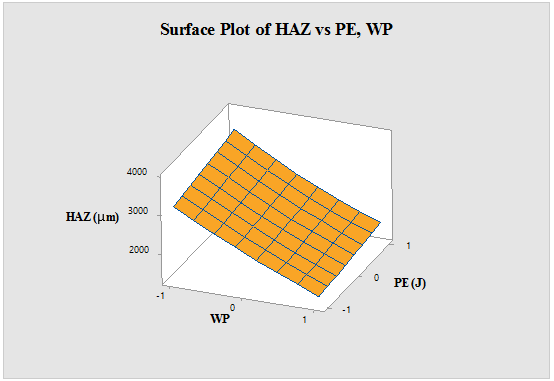
The HAZ response surface plot with regard to WP and PE are depicted in Fig. 4. As always smaller HAZ is demanded, they can be reached at the higher level of WP and lower level PE. This is due to the weak thermal conductivity of Ti6Al7Nbicompared to CP. Ti and low heat with low energ. Fig. 5 shows the concurrent effect of WP and Toni. It is obviously visible that higher HAZ can be obtained choosing a higher level of WP (Ti-6Al-7Nb) with lower Ton. The low HAZ of Ti6Al7N brand decrease in discharge energy on the WP and therefore HAZ decreases.
The effect of WP and WS on the estimated response surface of HAZ is depicted in Fig. 6, PE and Ton remain constant in their middle level of 12 J and 6 µsec, respectively. It can be noted that the HAZ decreases when WP remain at high level and WS at lowr level, for the same reason mentioned above for the WP and the low generated heat accumulation with low WS. Fig. 7 shows the estimated response surface for HAZ in relation to the process parameters of PE and Ton while WP and WS remain constant at their middle value. It can be seen from the figure, the HAZ tends to increase with the increase in PE and Ton. This can be attributed to the raise the input energy.
6. Conclusion
In this study HAZ of welded (C.P. Ti and Ti-6Al-7Nbralloys) via variable parameters PE, Ton, and WS as well as WP which is an essential point of pulsed Nd: YAG laser were analyzed. The significant items were concluded as following: 1. All the main effects of input parameters, i.e., WP, PE, Ton, and WS were found to be highly significant in affecting the HAZ. 2. In the HAZ response, changing WP from C.P. Ti to Ti-6Al-7NB and increasing WS results in decreasing in the HAZ, whereas an increasing PE and Ton causes there verse effect. 3. The interaction effects of (WP×PE), (WP×Ton), (WP×WS) and (PE×Ton) as well as only pure quadratic (squarer) of (WP2) have been found to significantly control the HAZ. 4. Multi response optimization indicates that the optimal combination of parameter settings are WP with number 9 and 27, PE of 15J, Ton of 0.888 ? sec and WS of 0.756mm/sec for achieving the required lower HAZ. 5. The error between experimental and predicted values at the optimum combination of parameter settings for HAZ lies within 0.1919%. Obviously, this confirms excellent reproducibility of the experimental conclusions.


| -6Al-7Nbi alloyiused |
| Codedi Factorsi | Actuali Factorsi | Parametersi | Unit | Codedi/Actualilevels -1i 0i 1 | ||
| Ai | WPi | workpiecesitypei | - | AAi | ABi | BBi |
| Bi | PEi | pulseienergyi | Ji | 9i | 12i | 15i |
| Ci | Toni | pulseidurationi | µseci | 4i | 6i | 8i |
| Di | WSi | weldingispeedi | mmi/sec | 3i | 5i | 7i |
| NOTE: | ||||||
| HAZi= 2383.3-871.22 × WPi+ 151.50 × PEi+ 88.83 |
| × Toni-121.94× WSi+ 94.5× WP 2 i-19.69× WPi×PEi- |
| 40.56 × WPi× Toni+ 54.94× WPi×WSi- |
| 21.06× PEi×Toni. |
| Termi | Coef. i | HAZ model T-valuei | P-valuei |
| Constanti | 2383.3i | 221.15i | 0.000i |
| WPi | -871.22 | -99.01i | 0.000i |
| PEi | 151.50i | 17.22i | 0.000i |
| Toni | 88.83i | 10.10i | 0.000i |
| WSi | -121.94i | -13.86i | 0.000i |
| WPi× WPi | 94.5i | 6.79i | 0.000i |
| PEi× PEi | - | - | - |
| Toni× Toni | - | - | - |
| WSi× WSi | - | - | - |
| WPi× PEi | -19.69i | -2.11i | 0.048i |
| WPi× Toni | -40.56i | -4.35i | 0.000i |
| WPi× WSi | 54.94i | 5.89i | 0.000i |
| PEi× Toni | -21.06i | -2.26i | 0.035i |
| PEi× WSi | - | - | - |
| Toni× WSi | - | - | - |
| R 2 (%)i | 98.38i | ||
| R 2 Adj. (%)i | 97.87i | ||
| R 2 Pred. (%)i | 96.62i |
| Sourcei | DFi | Adj SSi | AdjiMSi | Fi | Pi |
| U ForU iU HAZU i | |||||
| Regressioni | 9i | 14637610i 1626401i 1167.02i 0.000i | |||
| Lineari | 4i | 14485360i 3621340i 2598.49i 0.000i | |||
| WPi | 1i | 13662507i 13662507i 9803.52i 0.000i | |||
| PEi | 1i | 413140i | 413140i | 296.45i 0.000i | |
| Toni | 1i | 142045i | 142045i | 101.92i 0.000i | |
| WSi | 1i | 267668i | 267668i | 192.06i 0.000i | |
| Squarei | 1i | 64336i | 64336i | 46.16i | 0.000i |
| WPi× WPi | 1i | 64336i | 64336i | 46.16i | 0.000i |
| Interactioni | 4i | 87915i | 21979i | 15.77i | 0.000i |
| WP*PEi | 1i | 6202i | 6202i | 4.45i | 0.048i |
| WPi×Toni | 1i | 26325i | 26325i | 18.89i | 0.000i |
| WPi×WSi | 1i | 48290i | 48290i | 34.65i | 0.000i |
| PEi×Toni | 1i | 7098i | 7098i | 5.09i | 0.035i |
| Errori | 20i | 27873i | 1394i | ||
| Lack-of-Fiti | 15i | 27848i | 1857i | 373.80i 0.000i | |
| Pure Errori | 5i | 25i | 5i | ||
| Totali | 29i 14665483i | ||||
| Runi | WPi | PEi | Toni | WSi | AverageiHAZi(?m) | ||
| Orderi | --- | Ji | µseci. | mmi/s | Expt. i | Pred. i | Resi. i |
| 1i | -1i | -1i | -1i | 1i | 2893i | 2883.44i | 9.5599i |
| 2i | 1i | -1i | -1i | -1i | 1377i | 1443.38i | -66.3845i |
| 3i | -1i | -1i | 1i | -1i | 3472i | 3503.50i | -31.4956i |
| 4i | -1i | 1i | -1i | -1i | 3568i | 3594.33i | -26.3289i |
| 5i | 1i | 1i | -1i | 1i | 1653i | 1642.50i | 10.5044i |
| 6 i | 1 i | -1 i | 1 i | 1 i | 1488 i | 1482.66 i | 5.3377 i |
| 7 i | 0 i | 0 i | 0 i | 0 i | 2382 i | 2380.30 i | 1.7018 i |
| 8 i | 0 i | 0 i | 0 i | 0 i | 2379 i | 2380.30 i | -1.2982 i |
| 9 i | -1 i | 1 i | 1 i | 1 i | 3468 i | 3422.61 i | 45.3933 i |
| 10 i | 1 i | 1 i | 1 i | -1 i | 1835 i | 1865.55 i | -30.5512 i |
| 11 i | 0 i | -1 i | 0 i | 0 i | 2268 i | 2242.04 i | 25.9649 i |
| 12 i | 0 i | 0 i | 0 i | 0 i | 2382 i | 2380.30 i | 1.7018 i |
| 13 i | 0 i | 0 i | 0 i | 1 i | 2257 i | 2260.59 i | -3.5906 i |
| 14 i | 0 i | 0 i | 0 i | -1 i | 2507 i | 2504.48 i | 2.5205 i |
| 15 i | 0 i | 0 i | -1 i | 0 i | 2290 i | 2293.70 i | -3.7018 i |