1. Introduction a) Background Information
alnutrition refers to a condition that results from inadequate intake of food which nutrients are too little or too much that it causes health problems including a number of diseases, each with a specific reason related to one or more nutrients and each characterized by a cellular imbalance between the provider of nutrient and energy and the body's insist for them to ensure growth, maintenance and specific functions (WHO, 2006). Malnutrition remains a public health concern as there are 42 million under five years old children who are overweight, 99 million underweight, 51 million wasted and one in four children stunted globally (UNICEF, et al., 2014).
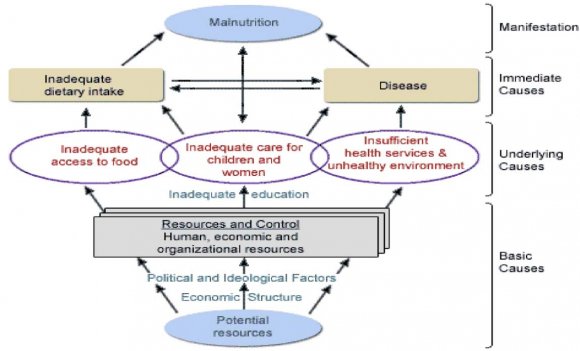
The basic causes of malnutrition are inadequate food intake and infections such as measles, respiratory infections and worm infestation (UNICEF & WHO, 2013). The underlying causes include unsanitary environment, inadequate care of women and children, poor health service and household food insecurity, while the basic causes are such as socio-cultural, economic and political.
Malnutrition results to worsening of health and lower life expectation (Caulfield, et al., 2004;Pelletier and Frongillo 2003) and hinders the potential for countries to reduce poverty (Grantham-McGregor, et al., 2007). Poor health and nutrition, and deficient healthcare derail the potential for cognitive development of about 200 million children under age 5 in developing countries (Ezzati, et al., 2002). This negatively affects school performance, thus lowering adult incomes, which in turn has negative implications for national development (Ezzati, et al., 2002). The joint effects of young children and maternal underweight account for about 15% of the global burden of disease as per (Black, et al., 2003).
Worldwide, the proportion of stunted children under age 5 in the developing world also reduced from 40% to 29% between 199029% between and 200829% between (UNICEF, 2009)). This reduction was mostly in East and Southeast Asia, Latin America and the Caribbean. Despite the global trend of decrease in malnutrition, it remains important in some areas of the earth (Blössner, et al., 2005). 2012 statistics showed that about 25% of the children under 5 years were stunted worldwide. Africa and Asia contributes to the 90% of the children that are stunted where 36% and 56% of the children are affected respectively (UNICEF and WHO, 2013).
2. M
In Sub-Sahara Africa, child under nutrition is one of the most basic challenges for better human development, slowing achievement of the goal of reducing child malnutrition (Kasirye, 2010). Studies on the continent of Africa that report rates of overweight and obesity have concentrated on the South African region and North and West African countries (Monyeki, et al., 2008;Senbanjo andAdejuyigbe, 2007 &Mokhtar, et al., 2007). The Demographic and Health Survey conducted in 2014 indicates that 26% of children are stunted, 4% wasted and 11% underweight, (National Bureau of Statistics Kenya and ICF International, 2015). This is an apparent reduction from previous survey in 2008/9 where 35% of children were stunted, 6.7% wasted and 16.1% underweight (KNBS and Macro, 2010). In spite of this reduction, Kenya portrays a wide variation in rates of malnutrition with marginalized counties of Kilifi, Mandera, Turkana and Bomet posting high rates of stunting that is above 35%. Nairobi, Kiambu have the lowest stunting rates of less than 16%, North Eastern has highest rates of wasting and underweight at 13% and 19%, respectively (KNBS, 2014).
Kenya has made considerable development in providing for the well-being of its citizens; however malnutrition in young children remains a matter of major public health concern. Prevalence of child malnutrition in Kenya is high with stunting (26.0%), wasting (4.0%) and underweight (11.0%) among children 0-60 months old. A study carried out in Siaya district, (n = 175) among children under age 5 reported that kids in their second year of life were more likely to be underweight and stunted. Early introduction to complementary feeding and presence of upper respiratory infection or other sickness in the past month was strong predictors of underweight (Bloss, et al., 2004).
Researches in the country have pointed to the importance of maternal education as a determinant of nutritional status among kids (Gewa, 2010& Deolalikar, 2010), implying that young children whose mothers have a secondary education are considerably taller than kids whose mothers have not gone to school. In Nyamira County in particular the prevalence of malnutrition among children under five is at 25.5% stunting, underweight at 9.6% and wasting at 4.1% (KDHS, 2014).
3. b) Statement of the Problem
Despite efforts by the government to provide for the well-being of its citizens, malnutrition in children under the age of five remains a major public health concern in Kenya. Malnutrition is linked with increased morbidity and mortality among children aged 6-59 months. Prevalence of child malnutrition in Kenya is high with stunting among children under-five years old (26.0%), wasting (4.0%) and underweight (11.0%) (KDHS, 2014). In Nyamira County the prevalence of malnutrition among children under five is 25.5% (stunting), underweight at 9.6% and wasting at 4.1% (KDHS, 2014). Although malnutrition is high in rural communities and those living in the slum settings because of poverty and food insecurity, not all children suffer from malnutrition even in food insecure situations. This indicates that other unique context specific factors may be critical in driving malnutrition. The study seeks to establish predictors of malnutrition among children aged What are the dietary practices of children aged 6-59 months attending MCH clinic at Ekerenyo Subcounty Hospital?
4. f) Justification
Providing adequate food to meet the nutritional needs of growing children is critical to prevent an increase in malnutrition prevalence, which would lead to excess mortality during the recovery phase of the condition. Nutritional status directly impacts the vulnerability for and the severity of infectious diseases that affect the children. Malnourished children are particularly vulnerable, as they cannot develop the protective compensatory mechanisms that allow healthy individuals to survive during periods of food deprivation. On the other hand, good nutritional status promotes wound healing and improves the postnatal outcomes in both mothers and babies.
5. g) Study limitations
This was a cross-sectional study done in a facility and therefore that limits the generalization research findings of the study within the population of study. Also the collected data using questionnaires relied heavily on recall basis which is definitely subject to respondent's bias.
6. II.
7. Literature Review a) The Concept of Malnutrition
Nutritional status refers to whether or not one is eating correct amounts or types of the required nutrients whereby malnutrition develops incase wrong types and incorrect amounts are consumed. Malnutrition is the lack of the right proportion of nutrients between which nutrients is supplied to the body and what the body needs for growth, maintenance and particular functions (World Health Organization, 2006). Various types of malnutrition have different manifestation. For instance, stunting is a height-for-age Z-score of less than -2 and due to chronic under nutrition. The condition leads to impairment of the normal body growth and the intellectual development. Wasting is weight-for-height Zscore that is less than -2. It can also be defined as Midupper Arm Circumference (MUAC) of less than 125mm and it is due to acute under nutrition. Stunting, wasting or both can lead to underweight which is weight-for-age Z-score of less than-2. On the other hand, overweight is weight-for-height Z score or Body Mass Index (BMI)for-Age Z-score of greater than +2 (United Nations Children's Fund, WHO & World Bank, 2014).
Prevalence of child malnutrition in Kenya is high with stunting (26.0%), wasting (4.0%) and underweight (11.0%) among children 0-60 months old. In Nyamira County the prevalence of malnutrition among children under five is at 25.5% stunting, underweight at 9.6% and wasting at 4.1% (KDHS, 2014). Numerous studies have reported alarming levels of malnutrition.
8. b) Indicators of Malnutrition i. Underweight
A child is considered to be underweight if the measured weight is ranges from 15% to 20% of the normal weight for their age group. The child can be underweight even when the other normal body proportions such as weight-to height ratios are okay (Golden, et al., 2000& Wittenberg, 2004). Underweight is a significant indication of malnutrition in most cases and this is missed in many instances. Diets with insufficient protein and/or energy lead to the decline of the linear height and the failure to gain more weight or even lose the weight. This comes out clearly when a child is exposed to an acute shortage of food. Research shows that in the developing world, about 129 million children who are below five years are underweight. Out of the 129 million, 10% are severely underweight. In Kenya, the prevalence was (20.3%) as at 2009 compared to 2000 when the prevalence was (21.2%) which shows that Kenya might not meet the MDGs (KNBS, 2010).
9. ii. Stunting
This is a condition where the growth rate is reduced. In a stunted growth the height for age value is less than -2 standard deviations of the WHO child growth standard median (WHO, 2014) compared to wasting and underweight, stunting in infants and children under the age of five is considered to be a worse problem. Stunting is an indicator of either an illness or nutritional deficiencies which might happen during a phase of growth and development (Shetty, 2002& UNICEF, 2009) the first sign of malnutrition in children is the stunted growth. In the developing world, about 195 million children of less than 5 years are affected. In Africa, one in three children is affected by stunted growth (Piercecchi Marti, et al., 2006). 2012 statistics showed that about 25% of the children under 5 years were stunted worldwide. Africa and Asia contributes to the 90% of the children that are stunted where 36% and 56% of the children are affected respectively (UNICEF and WHO, 2013). In Kenya stunting rates still remain high at 26% (KDHS, 2014).
10. iii. Wasting
A child is moderately wasted when the weight for height is less than -2 SD from the mean. If the child weight for height is less than 70% of the median and is equal to a standard deviation score of -3SD then the child is severally wasted (WHO, 2014). Moderate and severe wasting represents an acute form of malnutrition and children suffering from wasting are at a greater risk of dying (Williams, 2005). In 2011, the proportion of children below the age of five years who were found to be wasted was about 52 million globally and 1 out of every 10 children in Africa. The study showed that weight for age was statistically insignificant to malnutrition (Liu et al., 2012). In Kenya the prevalence of wasting is at 4% (KDHS, 2014). Wasting can be surmount by optimal feeding but may have permanent debilitating impacts such as cognitive impairment.
11. c) Socio-Economic Status of Women and Nutritional Status
Child under-nutrition is highly associated with the women's lack of the capacity to support child nutrition (Walker, et al., 2007). Also, the inability of the Causes of malnutrition include immediate, underlying and basic causes (UNICEF & WHO, 2013). Instant causes are inadequate food intake and infections such as measles, respiratory infections and worm infestation. Insanitary environment, inadequate care of women and children, poor health service and household food insecurity are all underlying causes of malnutrition. Basic causes are such as sociocultural, economic and political. Malnutrition therefore occurs when there is longer duration inconsistency between diet use and nutritional wants. Malnutrition remains a public health concern as there are 42 million under five years old children who are overweight, 99 million underweight, million wasted and one in four children stunted globally (UNICEF, et al., 2014).
women to have access or control the resources for their wellbeing has a negative impact on the nutrition and the health of the children (UNICEF, 2013). Low socioeconomic status of women is also associated with poor maternal nutrition before and even during pregnancy and this has a negative impact on the unborn baby resulting to low birth weight babies who are highly likely to develop malnutrition (UNICEF, 2013). A study in Uganda demonstrated that mother's education is the best prediction of the child's health in a community and not the household assets, land ownership or father's education (Wamani, et al., 2004). There was a significant relationship in the current study between low socioeconomic status of women and the child malnutrition with the children whose mothers had no employment, formal education and had their husbands made decisions on the food to be bought or cooked being the mostly affected. Sixty five percent of children whose mothers had no formal education were found to be malnourished compared to only 15% of the children whose mothers had formal education. Similarly, 63% of children from households where the food decisions were determined by the husband were discovered to be malnourished as compared to only 11% of children from households where the food decisions were influenced by children's needs. Thirty one percent of children whose mothers were housewives were found to be malnourished as opposed to only 6% of children whose mothers were self or formally employed. The community under study believes that women should not be allowed to make any decision even in the household. The women therefore become over dependent on their husbands for financial help as well as decision making. This explains the relationship between the malnourished children and socio-economic status of women in the study. Findings by ACF (2014) revealed that low level of maternal education was an important risk factor for child malnutrition among the same community that also led to early pregnancies and inadequate birth spacing.
High socio-economic status of women on the other hand prevents early marriages, early childbearing and having large families. Findings by Lisa, et al., (2003) also supported this where high women status was found to have a positive influence on children nutrition status leading to a reduction in stunting and wasting. Frangilo, et al., (1997) also demonstrated that high female literacy was one of the most significant factors linked with lower prevalence of wasting in children. This explains why 65% of children in the present study whose mothers had no formal education were malnourished. Majority (54%) of women in the study area stayed at home and waited to be provided for by their husbands hence had no control over what or how much to be offered for household use. This can then explain as to why 31% of children whose mothers were housewives were malnourished compared to only 6% of children whose mothers were employed.
Education level of an individual dictates the socio-economic status within a community as education is key to many socio-economic services. The level of education among women in the study area was low and may be attributed as to why 65% of children whose mothers did not have any formal education were found to be malnourished. Among other things woman with no education will not be in a position to prioritize the household needs or make crucial decisions that affect the child nutrition and health in general. A woman of low socioeconomic status has also low bargaining power within the household and this has a negative impact on nutrition and health of the children (Walker, et al., 2007). This is demonstrated in this study whereby 63% of children from the household where the food decisions were made by the husband were found to be malnourished. Some communities have a negative attitude towards women and would not involve them in any decision making and this further explains as to why a higher (63%) percentage of malnourished children was found in households where the husband was the decision maker on food consumption. The lack of decision making power of a woman in household and in society at large among the community under study was also demonstrated in an earlier study (ACF, 2014).
12. d) Dietary Practices of Children Aged 6-59 Months
One of the most efficient customs of improving child health is the use of optimal IYCF (WHO, 2003 & WHO, 2009). The morbidity and the mortality rate of children can be lowered by suitable feeding. Suitable feeding can also lower the risk of chronic diseases in the later life of the children (WHO, 2015).
The following practices have been proposed by the WHO and the UNICEF to ensure there is optimal use of IYCF: initiation of breastfeeding immediately after birth within one hour, breastfeeding exclusively for the first six months and introducing foods at six months that are nutritionally adequate and safe as the children are breastfed to two years and even beyond (WHO, 2003& WHO, 2015).
The IYCF (infant and young children feeding) was completely established by the Kenyan in 2007 (UNICEF, 2009). Other non-governmental agencies also contributed to the increase of the programme. However, Kenya has not attained the WHO goal of 90%. It is still below the world prevalence which is at 37%. Kenya has the lowest exclusive breastfeeding rates in east Africa region where the prevalence has been estimated to be 47% (UNICEF, 2011).
13. i. Breastfeeding
Breastfeeding plays an integral part in the reproductive process. It is an unequalled way of giving ideal foods to infants for their development and growth. Breastfeeding has crucial outcomes on the health of the child and the mother (Duan, et al., 2018).
Breastfeeding has short and long term benefits for the child. It is essential for the optimal growth of the child. The infections and the mortality rates are reduced through breastfeeding. Also, breastfeeding increases the motor and the mental development. Moreover, it protects the children against obesity and the other metabolic disease that affect people in their later lives (Kimani-Murage, et al., 2011& Rollins, et al., 2016).
Research has shown that half of the diarrhea infections and a third of the respiratory diseases can be eliminated through breastfeeding (Victora, et al., 2016). The breast milk has antibodies which help in fighting of diseases and protecting the children from respiratory infections and the diarrhea (Dòrea, 2009).
Some of the benefits of breast milk include: providing the baby with anti-bacterial, anti-parasitic and anti-viral agents which make the immune systems of the infant strong. Avoiding to breastfeed infants or breastfeeding the partial exposes them to the risks of diarrhea and the other infections (WHO, 2010). The infants' immune system and the response to vaccination can be stimulated by breastfeeding (Dòrea, 2009). Breast milk has been categorized as a personalized medicine for the infants (Victora, et al., 2016).
The first milk produced by a mother is called colostrum. Colostrum is rich in antibodies and has antiinfective properties that are very high. It serves as the first immunization for the infants (Bartle, 2013 & WHO, 2010). The IQ (intelligent quotient) of the infant is also improved through breastfeeding (Kramer & Kakuma, 2004). A higher IQ has always been associated with higher earnings and higher quality of life (Victora, Bahl, Barros, França, Horton, Krasevec, Murch, Sankar, Walker & Rollins, 2016). Other benefits include; neurological, visual as well as the motor development, protecting the infants against asthma, allergy and the other skin diseases. Moreover, breast milk protects children even in their later lives from conditions such as obesity and diabetes (UNICEF, 2011).
Optimal breast feeding is one of the most effective and efficient defensive measures for the survival of the child (Bartle, 2013 & Rollins, et al., 2016). Statistics taken in 2015 showed that the lives of about 800, 000 children below the age of five years could be saved by scaling up the breastfeeding levels (Black, et al., 2013; Victora, Barros, Franca, Horton, Krasever, Murch, Sanar, Walker & Rollins, 2016). Taking a balanced diet and optimal breastfeeding has an important impact on the health of the infants than immunization and clean water (Bartle, 2013).
14. ii. Initiation of Breastfeeding
There is proof that suggests that when breastfeeding is initiated within one hour after birth, the infants are protected from infections and deaths of the newborn (WHO, 2015). A research done in Ghana (Zandoh, Quigley, Amenga-Etego, Owusu-Agyei & Kirkwood, 2006) showed that breastfeeding within the first few hours after birth could up to 22% of neonatal deaths. It was also revealed that breastfeeding with the first day could prevent 16% of deaths. On another similar study, Nepal (Mullany, Katz, Li, Khatry, LeClerq, Darmstadt & Tielsch, 2008) revealed that about 19.1% of all neo-natal deaths that occur can be avoided through the initiation of breastfeeding within the first hour of a child's life. It is essential to initiate breastfeeding within the first hour after birth.
15. iii. Exclusive breastfeeding
Breastfeeding has crucial impacts on the health of the mother and the child. It plays an integral part in the reproductive process; research has shown that exclusive breastfeeding cannot be equaled by other meals (Duan, et al., 2018).
In the first six months of a child's development, breast milk with no other addition is enough to provide the needed nourishment. Breast milk has all the nutrients, antibodies and the immune factors that are needed by the infant (WHO, 2003). Mortality in the children can also be reduced by breastfeeding (Kramer & Kakuma, 2004). Out of the 10 million deaths of infants that happen every year of children under the age of 5, breastfeeding could reduce the figure by 1.4 million deaths (Black, et al., 2008& UNICEF, 2011).
At six moths children become more active. It is expected that at this time, they could have doubled their birth weight. At this stage, they need more nutritional foods for rapid growth. It is therefore essential that other foods are introduced at this stage as exclusive breastfeeding could not be sufficient for them (Jones, Steketee, Black, Bhutta & Morris, 2003).
Mothers also benefit from exclusive breastfeeding of their young ones. Breastfeeding reduces the risks of ovarian and breast cancer. Moreover, it helps the mothers in losing the weight gained during pregnancy. Also, it is a method of birth control which is known as lactation amenorrhoea method. This can help in spacing pregnancies ( To prevent malnutrition, factors such as promotion of the optimal breastfeeding, micronutrient supplementation, introduction of appropriated feeding in a timely manner and child care are some of the feasible measures that could be put in place (Saleh, et al., 2014).
The method of feeding that is chosen and the frequency of the meal should be appropriate for the age of the child. The child should be encouraged to take enough food even during a time of illness (WHO, 2003& WHO, 2005). It is unfortunate that most caregivers receive advice on feeding and information from unskilled sources such as the mothers and the mother in-laws. This makes it difficult for them to make out the best of food in the households due to the lack of knowledge of the best food for the young children, also the cultural practices and beliefs determines the type of food the children are given (Waswa, 2015).
Also, the knowledge and skills that women acquire from schools help them in determining when the children are ill so that they can seek treatment (Abuya, 2012). Use wrong feeding methods during complimentary feeding period have proven to negatively impact the health of the child. It is therefore important that women are educated on the interventions on infants and feeding of the young children. A study done on the education given to women on complimentary feeding showed that the children of mothers who received nutritional education improved both in height and weight (Imdad, et al., 2011).
16. v. Practicing Responsive Feeding
Optimal complimentary feeding is a factor of what is fed, how it is fed when and by whom the child is fed with (Pelto, Levitt & Thairu, 2003). In receptive feeding, the infants are only fed when they express hunger and no specific schedule if followed to feed them (Black and Aboud, 2011).
In receptive feeding system, the children are fed when they are sensitive to their hunger and the satiety cues. In this case, the caregiver has the responsibility of watching the children and responding to the cues for hunger and satiety from the children. Infants should not be forced to eat. The feeding should be done until they indicate to be full. The child should be breastfed anytime that they demand to be breastfed. This can be eight to 12 times in a period of 24 hour (WHO, 2009).
Responsive feeding is meant to improve the attentiveness and the interest of the child while feeding. It also enables them to communicate their needs to those who are their caregivers using some distinct signals and successful progression to the independent feeding (Black and Aboud, 2011;Bentley, et al., 2011& Eshel, et al., 2006). Responsive feeding is therefore used as a key to a healthy caregiving behavior. However, this technique might not be effective when a child is ill; when illness strikes, the intake of fluid and nutrient should be higher to cater for the losses that occur during this time through fever, diarrhea and vomiting (Dewey, 2015).
17. vi. Food Consistency
At six months, the kids can take smashed and semisolid foods. Finger foods can be eaten by the children at eight months. The finger foods are the snacks that can only be eaten by the child alone. As the infant gets older, there should be an increase in the foods take depending on the ability of the child and the requirements. After one year, the children should take the foods just as the ones taken by the rest of the family. The foods provided should be dense in nutrients. It is essential that a variety of foods are included while preparing food for the young ones so that the nutritional wants are met (WHO, 2005& WHO, 2009).
The use of micronutrient sprinkles with IYCF education reduces anemia and iron deficiency compared with IYCF education only (Jack, et al., 2012). With low intake of fortified foods, MNPS, poor dietary diversity, low minimum meal frequency, low minimum acceptable diet and meager intake of fortified foods in Wajir children at risk of micronutrient deficiency. Young ones should be given sprinkles and sustained until 2 years in order to cover up for the most vulnerable period.
18. vii. Meal Frequency and Energy Density
The amount and number of feedings given to an infant is dependent on the food's energy density. The frequency of feeding the child the complementary foods should be higher than the previous one as the child gets older for an infant who is well breast fed, the complimentary foods should be given two to three times in 24 hours from the sixth month to the eight month. The amount should then be increased to three to four times a day onward up to the age of two years. The snacks are the meals that are eaten between the meals and they can be taken by the child alone without the caregiver. Snacks are easily prepared and they are convenient. Examples of the snacks that are considered nutritious are the fruits and bread with peanut paste (Brown, Dewey & Allen, 1998; WHO, 2003).
For the children that are not well breastfed, they should be given meals that include milk. The milk and the other foods should be provided at least three to four times a day with the additional snacks two times a day as it may be desired. The number of feeding could also depend on the energy density of the foods that are provided. More recurrent meals should be given if the energy density of the foods is low (WHO, 2005). Households are regarded as food secure when everyone has access to enough food at all times to meet dietary supplies from either own production,
( D D D D )L purchase or food safety net programming (Simon, 2012). Moreover, one must consider the capacity of the body to utilize the food eaten, which is dependent on adequate knowledge on food nutrient, child care practices, health and sanitation (WHO, 2015).
19. viii. Providing a Variety of Nutrient-Rich Foods
Despite the advantages of breast milk, it has a low amount of some minerals such as iron and zinc. Therefore, the children should be introduced to other meals such as meat, fish, eggs and poultry. Such meals are rich in the minerals that lack in breast milk. Calcium can be obtained from the milk and the milk products and should also be given to the children. At a younger age, a diet which does not have animal products cannot meet all the nutritional needs of the children (WHO, 2003& WHO, 2005).
Children develop rapidly during their first two years and as a result, their bodies have high nutritional needs. The caregiver should therefore notice the nutrient content of the foods that are given as complementary to ensure that all the nutritional needs are met. It is also advisable that fortified complimentary foods or the vitamin-mineral supplements are given to the young ones (WHO, 2009).
Fat is also a crucial content in the diet. Fats can be obtained from paste made from nuts and other seeds. Vitamin A should also be included in the diet of the child. Vitamin A can be obtained from fruits and vegetables that are colored, vitamin A fortified oils and eggs. Foods rich in vitamin C should also be consumed to increase iron absorption (WHO, 2003).
20. e) Conceptual Framework
The conceptual framework in Figure 1.1 indicates the relationship between independent variables (predictors) and dependent variables.
21. Materials and Methods
22. a) Study Site
The study was conducted at Ekerenyo Subcounty Hospital in Nyamira County. The hospital is located in Nyamira North Sub-County (North Mugirango Constituency). It has a bed size of eighteen. Nyamira County has a population of 598, 252. The County borders the following counties; Homabay to the north, Kisii to the west, Bomet to the south east and Kericho to the east. The area covered by the County is 899.4km2.
23. b) Study Design
A descriptive cross-sectional study design was used to establish the predictors of malnutrition among children aged 6-59 months attending MCH clinic at Ekerenyo Sub-county Hospital.
24. c) Study Population
The study population was children aged 6-59 months attending MCH clinic at Ekerenyo Sub-county Hospital. The researcher employed systematic random sampling technique to select guardians and care-givers of children aged 6-59 months attending MCH clinic at Ekerenyo Sub-county hospital who were respondent into the study. The researcher picked the first who meet the inclusion criteria child randomly and there after every child who meet inclusion criteria and whose caregiver consented to participate was enrolled in the study. This was done every day of the week until the sample size was achieved for two months.
25. i. Inclusion Criteria
26. ii. Sample Size Determination
Using Cochran formula, (Cochran, 1977) a sample size was determined based on Kenya national prevalence of stunting which is estimated at 26% (National Bureau of Statistics-Kenya and ICF International, 2015). Cochran formula: n=z² (pq)/e² n = 1.96 x1.96 (0.26 x 0.74) 0.05x0.05 n = 295.649 n = 300 n = Sample size z = Linked to 95% confidence interval (1.96) p = Expected prevalence (as fraction of 1) (0.26) q = 1-P (expected non-prevalence) (0.74) e² = Desired precision of 0.05 for this study.
27. e) Study Variables i. Dependent Variable
The dependent variables include malnutrition identified as stunting, wasting underweight.
ii. Independent Variable Maternal characteristics religion, family incomes, level of education, occupation and child characteristics; age, sex, birth order, birthplace and mode of delivery were direct independent variables. Household characteristics; family size, marital status of caregiver, ownership of livestock, dietary practices and diseases two weeks before interview indirectly influenced malnutrition.
28. f) Data Management i. Data Collection Tools
? Questionnaire A questionnaire was used to gather data on social economic demographic characteristics of guardians and caregivers, dietary practices, and children's morbidity. The interview was conducted by the research team (the researcher and two research assistants) who were responsible for administering the questionnaire and entering all the data. The research assistants read out the question to the participants and then document the answer by either ticking, circling or writing the answer given by the participant on the space provided.
ii.
Anthropometry Anthropometric measurements were conducted by the researcher and two research assistants, trained in all aspects of data collection procedures. The researcher was assisted by one research assistant to take the measurement of weight and height of every child enrolled while the second assistant recorded the measurements in the questionnaire. The weights were measured to the nearest 0.1 kilograms using a portable bathroom scale. The heights were measured to the nearest 0.1 centimetres using the height board.
29. ? Procedure of Measuring the Heights of Children
A child whose height was 85cm and below was made to lie down on a measuring board. The child's head was supported by one hand while the rest of the body was supported by the other; the child was lowered into the measuring board. The child's head was placed against the base of the board with the knees firmly pressed against the board and foot piece firmly against the child's heel. The assistant ensured that the child looked up straight with line of sight perpendicular to the ground. Children whose height was above 85cm were measured standing on a height scale. The child stood straight on the board with knees firmly held against the measuring board. The head piece was lowed until the child head and measurements were taken. All the measurements were taken to the nearest 0.1cm. The readings were recorded in centimeters.
30. ? Procedure of Weighing Children
Children were weighed using infant electronic weighing scale model RCS-20 designed to take up weight of up to 20 kilograms. Children clothes were removed leaving them with a vest only. Older children above 12 months were weighed while seated on the scale, while those below 12 months were weighed lying supine on the scale. The weight was taken to the nearest 0.1kg.
31. ? Procedure of Measuring Mid Upper Arm
Circumference (MUAC) The child's shoulder tip was located using fingers. A right angle was made by bending the child's left hand elbow. Using a MUAC tape was the length from the tip of the shoulder to the tip of the elbow was measured to get the midpoint. The midpoint was marked using a pen. The child's arm was wrapped using a MUAC tape around the mid-point to measure the circumference. The readings were recorded to the nearest 0.1 centimeters.
32. g) Data Management and Analysis
33. i. Data Entry
Data was entered using Microsoft Access Software. Errors were minimized by cleaning and rechecking all data entries with original data forms. The data was then imported into excel which was used for coding and validation.
Backup of the data was done and filled questionnaires were cross-checked then stored in a lockable cabinet accessible only to research personnel o as to ensure privacy. The data was analyzed using quantitative techniques. Quantitative data was analyzed using Statistical Package for Social Sciences (SPSS 21). Descriptive statistics was used to sum up the sample population into percentages, frequency distributions and charts.
ii. Z-scores were interpreted as normal when the calculations were >-2 standard deviation, moderate when they were -3 to <-2 standard deviations and severe, when the readings were<-3 standard deviations in comparison to the reference population of healthy children using data from across the world for all indicators.
34. Data Analysis
Statistical Package for Social Scientists (SPSS) version 21 was used to analyze numerical and categorical data. After questionnaires were counter checked for completeness and legibility, double entry of all the data into SPSS computer program and database established for all variables. Descriptive statistics on demographic characteristics of respondents, socioeconomic, household characteristics and characteristics of study children were analyzed. Measures of central tendencies, dispersion and percentages were analyzed and presented as tables and bar graphs. Acrosstabulation using Chi-square test of association was used to assess the association between dependent variables; wasting, underweight and stunting and independent variables; demographic characteristics of respondents, socio-economic factors, child characteristics, feeding practices, and household characteristics. Chi-square values, degree of freedom and p-values described the association and significance level.
To determine the predictive factors, a binomial logistic regression was modeled. All variables that were found to be significant at bivariate level were entered into the regression model. The logistic regression model adapted for this study; Let;
P1=Pr(y=1) |x=xi) Then, Log (P1)/ (1-Pr) =Logit (P1) =Bo+B1Xi =P1/ (1-P1) =Exp (Bo+B1Xi) =P1=exp (Bo+B1X1)/ (1+exp (Bo+B1Xi))35. h) Ethical Considerations
Ethical clearance for the study was obtained from University of Eastern Africa, Baraton Ethical Review Committee. Participants for the study were informed about the purpose of the study. Confidentiality was retained by giving a reason for the intention of the study and obtaining permission from the participants. Information received from the study was not disclosed to illegitimate people; only data needed was gathered and utilized for the intention of study. The participants were given an option to withdraw from the study without consequences. The identity of the patient was protected by not using their names or other information identifying the participant. All questionnaires were collected soon after each interview and kept in lock and key.
IV.
36. Results and Discussion
37. a) Socio economic and demographic characteristics of the respondents
Two hundred and sixty one caregivers of children between the ages of 6 to 59 months were interviewed using structured questionnaires. The mean maternal age was 25.5(± 4.91) years and almost a half (45.6%) related with their mother and less than a quarter (4.2%) related with others. Nearly one third (30.7%) had attained secondary level education and a minimal number L respondents (50.6%) were Christians, (27.2%) protestant and (22.2%) were other denominations. Nearly a third (36%) of the families had two children each while small a number (3.4%) had more than five children each. More than three thirds of the women (78.5%) were married and less than a quarter were (4.2%) divorced/widowed and (17.3%) were single. Almost half of the households (46.7%) had 5-7 people compared to (0.8%) of the largest families who had more than 10 persons per household. The table 4.1 below illustrates the socialeconomic demographic characteristics of caregivers of children aged 6 to 59 months attending MCH clinic at Ekerenyo Sub-County Hospital. The study established that monthly earnings were less than Kes. 3000 for (26.4%) while (24.9%) for those earning between Kes. 3000-5000 and (10.7%) between Kes. 20000-30000. Almost half (44.8%) of the respondents were self employed, while (40.6%) were housewife and (14.6%) had other occupations. Majority (40.6%) of the respondents acquired wood fuel, a third (30.3%) used charcoal, (13.0%) used paraffin, (9.6%) used cooking gas, and (6.5%) used electric power as a source of fuel. On affordability of the source of fuel, almost half (44.1%) of the respondents said it was expensive, ( 4 below shows more than one third (37.2%) had attended antenatal visit once, (33.3%) had three antenatal visits, (20.7%) attended 2 visits, (6.5%) attended 4 antenatal visits and a small proportion (2.3%) never attended antenatal visits.
38. h) Bivariate Analysis
The study findings established from a total of 261 caregivers that grains and tubers as a dietary practice was associated with malnutrition on wasting (?2 =14.578, p-value= 0.056). The effect of grains and tubers as compared to other dietary practices was not statistically significant on underweight (?2 =9.145, p-value=0.147) and stunting (?2 =3.255, p-value= 0.789). This is illustrated in the table 4.5 below.
39. Association of monthly incomes factors on the nutritional status of children aged 6-59 months attending baby well clinic at Ekerenyo sub county hospital
A total of 261 caregivers of children were interviewed on their monthly incomes to establish association with malnutrition status of children aged between 6-59 months. The caregivers within the low income bracket earning less than Kes. 3,000 was statistically significant associated with malnutrition status of children as depicted with wasting (?2 =18.677, p-value=0.007), underweight (?2 =16.
40. V. Conclusion and Recommendations a) Conclusion
Malnutrition prevalence remains an alarming issue in the country. It merges that nearly half of all deaths in children under 5 are attributable to malnutrition; malnutrition puts children at greater risk of dying from common infections, increases the frequency and severity of such infections, and delays recovery. The interaction between malnutrition and infection can create a potentially lethal cycle of worsening illness and deteriorating nutritional status. Poor nutrition in the first 1,000 days of a child's life can also lead to stunted growth, which is associated with impaired cognitive ability and reduced school and work performance.
The findings of the study established that wasting (WHZ<-2SD) was 1.2% with 0.4% severely wasted. The proportion of children who were underweight (WAZ<-2SD) was 6.5% of whom 1.1% were severely underweight. Stunting (HAZ<-2SD) was 13.4% with 1.5% severely wasted. The effect of wasting associated with malnutrition was significant (?2 12.543, p-value =0.013) and underweight (?2 10.143, p-value =0.026). The effect of stunting with malnutrition was slightly significant (?2 8.223, p-value =0.056). Scientific evidence has shown that beyond the age of 6-59 months the effects of chronic malnutrition are irreversible. This means that to break the intergenerational transmission of poverty and malnutrition, children at risk must be reached during their first two years of life. Child malnutrition is the single biggest contributor to under-five mortality due to greater susceptibility to infections and slow recovery from illness.
41. b) Recommendations
Providing adequate food to meet the nutritional needs of growing children is critical to prevent an increase in malnutrition prevalence, which would lead to excess mortality during the recovery phase of the condition. Malnourished children are particularly vulnerable, as they cannot develop the protective compensatory mechanisms that allow healthy individuals to survive during periods of food deprivation. On the other hand, good nutritional status promotes wound healing and improves the postnatal outcomes in both mothers and babies. According to the World Health Organization (WHO), "food security exists when all people, at all times, have access to sufficient, safe and nutritious food to meet their dietary needs and food preferences, and to maintain an active and healthy life. Adequate nutrition is vital to everyone's health and wellbeing. Even in the best of times there are multiple challenges to proper nutrition. The study recommends the following;
i.
There should be intersect oral collaboration among stakeholders to work together to strengthen nutritional services. ii. To achieve optimal results, participation and iii. There should be provision of essential services and increasing access to healthcare to reduce burden of diseases, which increase vulnerability to diseases. iv. The community members' capacity on balanced diet should be enhanced; they should take a balanced diet.
| c) Study Objectives | |
| i. Broad Objective | |
| To establish predictors of malnutrition among | |
| children aged 6-59 months attending MCH clinic at | |
| Ekerenyo Sub-County Hospital in Nyamira County. | |
| d) Specific Objectives | |
| i. | To determine the socio economic demographic |
| characteristics of care givers of children aged 6-59 | |
| months attending MCH clinic at Ekerenyo Sub- | |
| county Hospital. | |
| ii. To determine the dietary practices of children | |
| aged 6-59 months attending MCH clinic at | |
| Ekerenyo Sub-county Hospital. | |
| e) Research Questions | |
| What are the social economic demographic | |
| characteristics of caregivers of children aged 6-59 | |
| months attending MCH clinic at Ekerenyo Sub-county | |
| Hospital? | |
| Labbok, |
| Clark & Goldman, 2004; Rollins, et al., 2016). |
| Breast milk has high quality nutrients for the |
| children (WHO, 2003; WHO & UNICEF, 2008). Between |
| 6 months to 12 months, half of the energy needs of the |
| child can be provided by breast milk. Between 12 to 24 |
| months a third of the child's energy needs can be |
| provided by breast milk (Dewey & Brown, 2003). Breast |
| milk therefore becomes very significant for the child |
| especially in a setup where the resources are |
| constrained (WHO, 2009). |
| iv. |
| Variable | Frequency | Percentage (%) | |
| Caregivers' Age in Years (N=261) | |||
| <20 | 27 | 10.3 | |
| Year 2021 | 21-30 31-40 >40 | 189 40 5 | 72.5 15.3 1.9 |
| 36 | Relationship with Child(N=261) | ||
| Volume XXI Issue I Version I | Mother Aunt Sister Others Level of education(N=261) Non-formal learning Primary school Secondary school Technical/polytechnic College/University Religion N=261 | 119 74 57 11 73 65 80 29 14 | 45.6 28.4 21.8 4.2 28.0 24.9 30.7 11.1 5.4 |
| D D D D ) L | Christian | 132 | 50.6 |
| ( | Protestants | 71 | 27.2 |
| Medical Research | Others Number of children N=261 One Two Three Four More than five | 58 34 94 81 43 9 | 22.2 13.0 31.0 16.5 3.4 36.0 |
| Global Journal of | Marital Status (N=261) Married Divorced Widowed Single People living in the households N=(261) 2-4 | 205 7 4 45 111 | 78.5 2.7 1.5 17.3 42.5 |
| 5-7 | 122 | 46.7 | |
| 8-9 | 26 | 10.0 | |
| Above 10 | 2 | 0.8 | |
| Source; (Research Findings, 2019) | |||
| b) Socio Economic characteristics among the | |||
| Respondents | |||
| Approximately a third (33.0%) of the house head | |||
| were farmers, a quarter were business persons and in | |||
| formal employment (26.4%) and (25.3%) respectively. | |||
| © 2021 Global Journals | |||
| Variable | Frequency | Percentage (%) |
| Occupation of Head of the House (N=261) | ||
| Business | 69 | 26.4 |
| Formal Employment | 66 | 25.3 |
| Farmer | 86 | 33.0 |
| Others | 40 | 15.3 |
| Monthly incomes Kes.(N=261) | ||
| Less than 3000 | 69 | 26.4 |
| 3000-10000 | 65 | 24.9 |
| 10000-15000 | 60 | 23.0 |
| 15000-20000 | 39 | 14.9 |
| 20000-30000 | 28 | 10.7 |
| Occupation of caregiver (N=261) | ||
| Housewife | 106 | 40.6 |
| Self employed | 117 | 44.8 |
| Others | 38 | 14.6 |
| Source of fuel (N=261) | ||
| Wood fuel | 106 | 40.6 |
| Charcoal | 79 | 30.3 |
| Paraffin | 34 | 13.0 |
| Cooking Gas | 25 | 9.6 |
| Electric Power | 17 | 6.5 |
| Affordability of Source of Fuel (N=261) | ||
| Expensive | 115 | 44.1 |
| Moderate | 110 | 42.1 |
| Affordable | 36 | 13.8 |
| Livestock ownership (N=261) | ||
| Yes | 165 | 63.2 |
| No | 96 | 36.8 |
| Type of Livestock kept (N=165) | ||
| Goat | 29 | 17.6 |
| Sheep | 5 | 3.0 |
| Poultry | 91 | 55.2 |
| Cow | 40 | 24.2 |
| Key: Kes = Kenya ShillingsSource; | ||
| (Research Findings, 2019) | ||
| c) Distribution of Type of Foods Introduced among | ||
| children aged 6 to 59 months attending MCH clinic | ||
| at Ekerenyo Sub-County Hospital. | ||
| The study findings reveals the type of food | ||
| introduced as illustrated in figure 4.2 below. The main | ||
| food introduced was uji (40.6%), milk (38.3%), mashed | ||
| bananas (10%), 21 (8%) mashed potatoes (8%) and a | ||
| small proportion of mashed fruits (3.1%). |
| Variable | Frequency | Percentage (%) |
| Heard about balanced diet N=261 | ||
| Yes | 184 | 70.5 |
| No | 77 | 29.5 |
| Source of dietary practices | ||
| information( N=184) | ||
| TV | 33 | 17.9 |
| Radio | 53 | 28.8 |
| Healthcare workers | 34 | 18.5 |
| Friends | 28 | 15.2 |
| Newspapers | 36 | 19.6 |
| Food groups consumed in the | ||
| households | ||
| Grains and tubers(N=261) | 257 | 98.5 |
| Legumes and nuts(N=261) | 236 | 90.4 |
| Dairy products(milk, yogurt, | 201 | 77.0 |
| cheese(N=261) | ||
| Flesh foods(meet, fish, poultry | 2 | 0.8 |
| and liver/organ meats(N=261) | ||
| Eggs(N=261) | 9 | 3.4 |
| Vitamin-A rich fruits and | 14 | 5.4 |
| vegetables(N=261) | ||
| Other fruits and | 96 | 36.8 |
| vegetables(N=261) | ||
| Acquire foods(N=261) | ||
| Own farms | 140 | 53.6 |
| Food Aid | 13 | 4.9 |
| Shops | 69 | 26.4 |
| Purchase at roadside | 39 | 14.9 |
| Frequency of feeding (N=261) | ||
| On demand | 110 | 42.2 |
| 2 Times a day | 86 | 32.9 |
| 3 to 4 times a day | 65 | 24.9 |
| Child's food intake in the last | ||
| 24 hrs | ||
| Grains and tubers(N=261) | 229 | 87.7 |
| Legumes and nuts(N=261) | 81 | 31.0 |
| Dairy products(milk, yogurt, | 187 | 71.6 |
| cheese(N=261) | ||
| Flesh foods(meet, fish, poultry | 14 | 5.4 |
| and liver/organ meats(N=261) | ||
| Eggs(N=261) | 21 | 8.0 |
| Vitamin-A rich fruits and | 37 | 14.2 |
| vegetables(N=261) | ||
| Other fruits and | 129 | 49.4 |
| vegetables(N=261) | ||
| Source; (Research Findings, 2019) | ||
| Almost three third (70.5%) of caregivers have | vegetables (36.4%). (5.4%) vitamin-A rich fruits and | |
| heard about balanced diet from different segments. | vegetables, (3.4%) eggs, and a small proportion of | |
| More than a quarter (28%) got informed from radio, and | (0.8%) took meat. The study established that majority | |
| 19.6%, 18.5%, 17.9% and 15.2% were informed from the | (53.6%) acquired food from farms, (26.4%) acquire | |
| newspapers, healthcare workers, television and friends | foods from shops, (14.9%) purchase at roadside and | |
| respectively. The study established that majority of | (4.9%) acquire food from food aid to meet their needs. | |
| caregivers feed on grains and tubers (98.5%), legumes | Majority caregivers feed their children on demand | |
| and nuts (90.4%), milk was (77%) and fruits and | ||
| Variable | WHZ<-2SD | WHZ?-2SD | ?2 | Df | p-value | ||
| n | % | n | % | ||||
| Dietary Practices (N=261) | |||||||
| Grains and tubers | 2 | 0.8 | 259 | 92.2 | 14.578 | 4 | 0.056 |
| Legumes and nuts | 1 | 0.4 | 260 | 99.6 | |||
| Dairy products | 0 | 0 | 261 | 100 | |||
| Flesh foods(Meat) | 0 | 0 | 261 | 100 | |||
| Eggs | 0 | 0 | 261 | 100 | |||
| Vitamin-Arich fruits & vegetables | 0 | 0 | 261 | 100 | |||
| Other fruits &vegetables | 0 | 0 | 261 | 100 | |||
| WAZ<-2SD | WAZ?-2SD | ||||||
| Grains and tubers | 9 | 3.4 | 252 | 96.6 | 9.145 | 4 | 0.147 |
| Legumes and nuts | 5 | 1.9 | 256 | 98.1 | |||
| Dairy products | 2 | 0.8 | 259 | 99.2 | |||
| Flesh foods(Meat) | 0 | 0 | 261 | 100 | |||
| Eggs | 1 | 0.3 | 260 | 99.7 | |||
| Vitamin -A fruits & vegetables | 0 | 0 | 261 | 100 | |||
| Other fruits & vegetables | 0 | 0 | 261 | 100 | |||
| HAZ<-2SD | HAZ?-2SD | ||||||
| Grains and tubers | 14 | 5.4 | 247 | 94.6 | 3.255 | 4 | 0.789 |
| Legumes and nuts | 11 | 4.2 | 250 | 95.8 | |||
| Dairy products | 5 | 1.9 | 256 | 98.1 | |||
| Flesh foods(Meat) | 1 | 0.4 | 260 | 99.6 | |||
| Eggs | 1 | 0.4 | 260 | 99.6 | |||
| Vitamin-A rich fruits & vegetables | 1 | 0.4 | 260 | 99.6 | |||
| Other fruits &vegetables | 2 | 0.8 | 259 | 99.2 | |||
| Source; (Research Findings, 2019) | |||||||
| Key: WHZ=Weight for Height Z-scores, WAZ= Weight for Age Z-scores, HAZ= Height for Age Z-scores | |||||||
| D D D D |
| ii. |