1. Introduction
ife expectancy (LE) is frequently used as an indicator of the health of a population. Identifying gaps in life expectancy between different groups in different provinces and territories helps draw attention to particularly vulnerable populations in Canada. However, life expectancy measures the length rather than the quality of life, and does not necessarily represent the number of years spent in good health [1].
In the last five decades, life expectancy in Canada has been ranked in the top 10 among the 34 countries now in the Organization for Economic Cooperation and Development (OECD) [2][3]. In 2007, the most recent period for which data are available for all OECD countries, Canada ranked ninth, with a life expectancy at birth of 80.7 years for both sexes combined. This was 1.9 years lower than the first-ranked country, Japan. Canadian men were in eighth place, 1.2 years below top-ranked Switzerland, and Canadian women were tied for ninth with Sweden, 3.0 years below Japan [4].
The gap in life expectancy between males and females differs by country. In Canada, life expectancy at birth is 4.6 years longer for women than men. Among the top 10 OECD countries, the gap in life expectancy is largest in France (7.0 years) and smallest in Iceland (3.5 years) [4].
The objective of this study is to identify where Canada has the highest overall life expectancy, and to relate the findings to associated health behaviours and socio-demographic characteristics.
2. II.
3. Data and Methods
We used the Canadian Vital Statistics Death Database for the period of 1986 to 2007. All death records are based on information abstracted and compiled from death certificates and are provided to Statistics Canada by the vital statistics registrars in each province or territory. The mortality data in this analysis are coded using both the 9 th and 10 th Revision of the International Classification of Diseases (ICD-9 and ICD-10). Annual population estimates were taken from Statistics Canada's annual demographic statistics (Statistics Canada. Annual Demographic Estimates: Canada, Provinces and Territories 2011). For each province or territory (Northwest Territory, Yukon, and Nunavut) and health regions, overall average and sexspecific mortality rates were calculated for the study period.The annual population was considered as a weight to produce a weighted average of annual mortality rate and life expectancy for provinces/territories and health regions.
Life expectancy was then related to the health regions by age and sex. These variables were examined together, with socio -demographic characteristics. A peer group was created based on similarities in the populations of health regions along a number of sociological categories, including: income inequality; percentage of the population aged 65+; unemployment rate; property ownership; and average years of schooling [5].We compared the significant differences among respective peer groups, provinces/territories and the Canadian national level group.
When the result is "0", this means there is no statistical difference; "+1" means there is a positive statistical difference; and "-1" means there is a negative statistical difference between compared groups.
LE analysis was conducted to explore time trend for Canadians mortality rate from 1986 to 2007 by all causes, age, and sex. All analyses were conducted by using SAS, version 9.1, statistical software.
4. III.
5. Results
6. Life
expectancy in Canada improved significantly from 1986 to 2007.
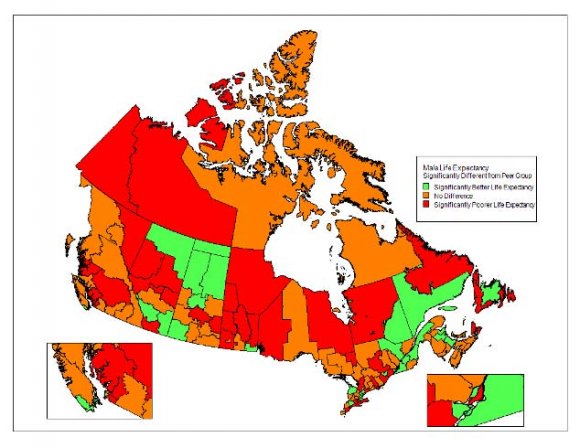
Women's life expectancy at birth increased from 79.8 years in 1986 to 83.0 years in 2007, while men's increased from 73.2 to 78.4 years in the same period-increases of 3.2 years for women and 5.2 for men (Figure 1). Our study noted only modest variability in LE by province, with the only noteworthy exception being the much lower female LE in Newfoundland and Labrador. Figure 2 shows how life expectancy at birth varies across Canada. Among the provinces in 2007, British Columbia (BC) had the longest life expectancy, 81.2 years, following by Ontario (81.0), Quebec (80.7), Alberta (80.5), PEI (80.2), and New Brunswick (80.0). Newfoundland and Labrador had the lowest, 78.3 years. However, when we compare the differences between 1986 and 2007 period, we found that the highest increase in LE was for PEI, there are 4.3 years difference, higher than average (4.2) in the general population. Ontario was 4.2 years, the same as in the average LE in Canada. LE in other provinces and territories were lower than general population (Figure 2). YKT/NWT/NUT-Yukon Territory/North West Territory/Nunavut Territory LE in the different health regions of different provinces and territories varied in health regions and sex. The three regions with the highest LE were Richmond Health Service Delivery Area (BC), York Regional Health Unit (ON), and Peel Regional Health Unit (ON) in both sexes (84.6, 83.8, 83.2), males (82.6, 82.0, 81.3), and females (86.2, 85.4, 84.9) respectively. In contrast, the three regions with the lowest LE were Région du Nunavik (QC), Burntwood/Churchill (MB), and Nunavut Territory in both sexes (71.3, 71.3, 72.0), males (69.3, 68.4, 68.9), and females (72.5, 74.6, 76.0). Results showed that the three highest LE have positive statistical difference in comparing with the previous reference period (+1), the Canadian national level (+1), the peer group rate (+1) and the provincial level (+1). However, the three regions with the lowest LE were negative statistical lower than the Canadian national level (-1), the peer group rate (-1) and the provincial level (-1). (Table 1
7. Discussion
Life Expectancy (LE) is a commonly used component of the Human Development Index (HDI), along with adult literacy, education, and standard of living [6].
Although our study noted only modest differences in LE by province, we observed large variations in LE by health regions. This highlights the importance of conducting surveillance with sufficient granularity to adequately inform public health action. Health regions with low LE in tended to be clustered in the north, while those with high LE in tended to be in regions in the south which were most urbanized and had experienced the highest levels of immigration. The most disadvantaged health units had life expectancies comparable to those experienced in Canada as a whole 40 years ago [7].
Life expectancy is lower for males than for females: this gap has been present to varying degrees for nearly a century. This gap between the sexes narrowed over the study period [8][9][10].
The reasons for this may be that life expectancy tends to be lower in regions with poor living conditions, a lack of primary health care, higher accident rates, and the rates ofsmoking, heavy drinking and obesity are relatively higher than other regions in Canada [11][12][13][14][15][16].
These regions also have higher rates of extended unemployment, fewer high school and university graduates, a relatively larger Aboriginal population and are generally tended to be more rural and remote [17].
Our results are comparable to those in some European countries and in Japan. The difference in life expectancy at birth between the best and worst European countries in this respect is more than 10 years for both sexes. Life expectancy at birth in the European Union-27 countries (new members after 2004) was 75.1 years (men) and 81.3 years (women). The difference between the 10th and 90th percentile of 272 regions was 8.0 (men) and 5.6 years (women). Men lived 6.1 years and women 3.9 years shorter in the new member states (NMS, new members since 2004) than in the European Union-15 countries.
The main causes explaining differences in life expectancy are ischemic and other heart disease, stroke, alcohol related mortality, lung cancer and injuries [18][19][20][21]. The contributions of medical care and pollution are likely to be modest; health behaviour, diet, and alcohol consumption seem to be more important; smoking seems to have the largest impact [11][12][13][22][23][24]. In contrast, people in health regions with life expectancy higher than the Canadian average practice good health behaviours, have high average years of schooling, high


| Figure 2: | ||||||||||
| CAN | 76.5 | 80.7 | ||||||||
| NL | 76.3 | 78.3 | ||||||||
| PEI | 75.9 | 80.2 | ||||||||
| Provinces/Territories | SK MB ON QC NB NS | 77.0 76.8 76.5 76.4 76.1 75.9 | 79.5 79.3 79.7 80.0 | 81.0 80.7 | ||||||
| AB | 76.7 | 80.5 | ||||||||
| BC | 77.6 | 81.2 | ||||||||
| YT/NT/NU | 75.8 | |||||||||
| 73 | 74 | 75 | 76 | 77 | 78 | 79 | 80 | 81 | 82 | |
| Life of Expectancy (year) | ||||||||||
| Compared to Compared to Compared to Compared to | previous national level peer group provincial level | period | Male Female Male Female Male Female Male Female | ||||
| Canadian national level group in Canada 2005-2007* | Life expectancy by sex and 95% confidential interval | Three top highest LE in the health regions | Code Both 95%C.I. Male 95%C.I. Femae 95%C.I. | Richmond Health | Service Delivery 5931 84.6 84.2 84.9 82.6 82.1 83.2 86.2 85.7 86.7 | Area |