1. Introduction
A number of investigators have reported reference values for renal length [8][9][10][11][12][13] and renal volume in healthy adults [8][9], as measured by ultrasonography. The ultrasonography method that is used to measure kidney volumes is two-dimensional in nature, and is operator dependent, and uses geometric assumptions about the shape of the kidney to estimate kidney volumes. In contrast, computed tomography (CT) and magnetic resonance imaging (MRI) can acquire threedimensional data and, therefore, it can estimate organs volumes. In the case of CT, the need for ionizing radiation and contrast media limits its place as a routine noninvasive imaging method for measuring kidney volumes. Conversely, MRI has the benefit of acquiring true tomographic data along any direction, without the constraints of ionizing radiation and nephrotoxic contrast burden. Nevertheless, the literature contains few reports of renal dimensions as determined by MRI. [9] Furthermore, although CT and MRI can be used to measure renal volume accurately with voxel countbased methods [14]. These techniques present problems of radiation exposure, and toxicity associated with renal contrast agents [15]. MRI estimation of kidney volumes can be determined using different methods including the water displacement, disc-summation and other mathematical methods [16].It should be noted that tomographic images of the kidneys that were acquired using MRI can provide reliable and consistent determinations of kidney volume without the geometric assumption limitations that are inherent in other methods of measurements. [16].The changes in the acquired spatial resolution of the imaging techniques from a coarse spatial resolution to a fine spatial resolution did not have an appreciable effect on the mean kidney volume
( D D D D )Year 2014
2. D
measured. This suggests that the spatial resolution that was used in routine patient studies is sufficient to Abstract-Knowledge of kidney character is important for clinical assessments of renal diseases. The aims of this study were to establish a normal range of values for kidney length and volume in normal Sudanese adults with no known history of renal disease and to determine the usefulness of body mass index (BMI), Body surface area (BSA), Glomerular filtration rate (GFR), Total body water (TBW), Creatinine Clearance(Crcl), Serum Creatinine Level (Scr) for prediction of kidney characters.
98 consecutive patients (43 females; 55 males) who had undergone axial T 1 , T 2 weighted abdominal MRI images, were obtained during the period from June 2012 to June 2013 for indications other than renal diseases. Excluded patients were those who had renal cysts, hydronephrosis, and congenital kidney diseases. Detailed demographic information of the sample were recorded. The kidneys volume and length were measured using Disc Summation Method and the relations between the variables were studied.
The study showed that the kidneys length measured for normal Sudanese subjects were 10.08±0.46, 10.67±0.47 and the volumes were 101.6±12.98, 104.0±12.99 for right and left kidneys respectively, and it differed from other population. There were significant differences between males and females measurements and the correlation was significant between kidneys length and volume with BMI, TBW and subjects height. New equations were established to measure the kidneys length and volume.
Our study confirmed that there was significant relation between the CrCl, GFR, and serum creatinine level with BSA, BMI, TBW, weight, gender and age and revealed that the kidney volume predicted the renal function significantly at p=0.005, for SCr p-value=0.056, 0.007, CrCl p-value=0.054, 0.043 and GFR p value= 0.051, 0.59 for right and left kidneys volume.
MRI measurements using disc summation method for renal volume and length were accurate and a reference values were established for adult Sudanese subjects and were well correlated with body parameters and renal function.
enal length and volume are important parameters in clinical settings. [1][2][3][4][5] Kidney volume is a more sensitive index of kidney size than kidney length for the detection of renal abnormalities. [6] It is also excellent predictor of renal function and correlates very well with body indices. [7] R measure the kidney volumes accurately, and does not introduce significant errors in volume calculations. [16] A number of reports have depicted measurement of renal length and volume in the healthy Western population, but there are limited data regarding MR measurement of renal dimensions in adults and as far as our knowledge no study was done regarding the adult Sudanese's kidneys measurements in the open literature as an African population.
The purpose of this work was to establish reference values for renal length and volume using MRI disc summation method in normal Sudanese adults with no clinical history of renal disease as well as to correlate the measurements with body characteristics including body mass index (BMI), Body surface area (BSA), Total body water (TBW), and renal function including Creatinine Clearance (Crcl), Serum Creatinine Level (Scr) and Glomerular filtration rate (GFR),
3. b) Method of Kidneys length and volume measurements
Disk summation method (DSM) was used to calculate the volume of normal kidney in normal individuals. In the DSM, the measurement is dependent on the picture element (pixel-px), by counting the total number of pxs per unit area (only renal area excluding the rest of FOV, and is represented in (px 2 ). Then the pixels were converted into units of area in (mm 2 ). That was done by multiplying the area in (px 2 ) by conversion constant (0.26 2 ), Then multiplying the product by slice thickness in (mm), which represents slice height an Zaxis ,and consequently the product is in unit volume (mm 3 ) for the single slice. Then dividing the value in (mm 3 ) over (1000) to convert to (cm 3 ). This formula was applied to each separate slice to final the total volume of both kidneys. As shown in following equations:
? Px 2 (number of pixels) 2 x(0.26) 2 =Area in (mm) 2 ? Area (mm) 2 xslice thickness (mm) = volume (mm) 3
? Volume (mm) 3 /1000 = volume (cm) 3
? Total volume of kidney = ?slices volumes.
Three measurements were calculated to determine the (complete volume) including length, width, and depth, according to the assumption that kidney is degrader (cylindrical shape), which was the product of multiplying 3 dimension length Z-axis x width X-axis x depth Y-axis. To determine the length which is represented by unit distance in the Z-axis according to patient's position inside the gantry of MRI, and can be expressed by slice thickness, and is calculated by:
? Length = number of slices (in which kidney appeared) x slice thickness (cm).
? The width was also represented in unit length in the X-axis, and calculated by the cube root of volume (cm) 3 .
? Width =??????????? 3 ???????????? (????) 3.? The depth, in unit length on the Y-axis was calculated by, dividing the square root largest area calculated in (mm) 2 over 10.
? Depth (cm) =??????????????? ???????? (????) 2 /10.
? After determining the 3 dimensions above, the assumed renal volume can be calculated based on the mathematical rule:
? Volume (cm) 3 = length x depth x width.
4. c) Methods of variables evaluation
Variables including: height; which was measured in (cm). weight in (kg), age in (yrs) and gender (male or female) were evaluated. For measuring dependent variables: Body surface area (BSA) was measured in (mm) 2 , total body water (TBW) in (liters) and Glomerulo filtration rate (GFR) by (Cock -Craft-Gault) (CG) equation in (ml/min/1.73.mm 2 ).
To calculate BSA in (m) 2 :{(height (cm))x(weight(kg))x3600}x1/2 Total body water is calculated by Watson's formula:
? TBW male = (2.477-0.09516 x age (yrs) +0.1074 x height (cm) +0.3362 x weight (Kg). ? TBW female = (-2.097+ (0.106) x height (cm) +0.2466
x weight (kg).
? To determine (GFR), the CG-GFR equation was used:
? CrCl X BSA / 1.73(m) 2 =GFR .
5. Discussion
Renal length and volume measurements are clinically relevant, serving as surrogates for renal functional reserve, and are used frequently as the basis for making clinical decisions. Serial measurements also can provide information regarding disease progression or stability.
The aims of this study were to establish reference values and define the normal kidney length and volume of Sudanese adults using MRI as well as to determine the relationship between kidney character and Sudanese body indices.
Correlations between measurements of the kidneys and body indices were calculated. The data were expressed as means ± SD. Kidneys length and volume were analyzed separately for males and females as well as the total sample. The data statistical analyses were performed using Excel software programme and statistical analyses were performed using the independent sample t-test, simple correlations (SPSS software version 16.0 USA). Statistical significance was assumed at P < 0.05.
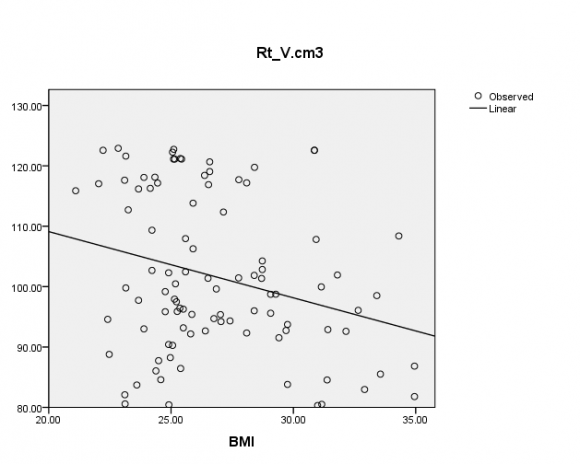
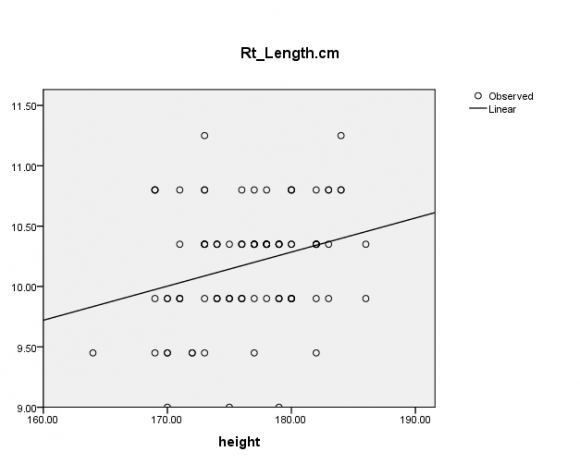
Table [1] showed the demographic data of the whole sample including weight, age, body surface area (BSA), body mass index (BMI), height, total body water (TBW), serum Creatinin, creatinin clearance , Glomerular filtration rate (GFR). The kidneys volumes and lengths for the total sample were measured and also for males and females subjects as presented in tables [2] and[4,5] The kidneys volumes were found to be in the ranges from ( The cause of this difference may be due to the method of measurements or other factors. In the literature it was noted that the Sonographic measurements of renal volume are very inaccurate [9,22,23] The volume of kidneys can be accurately measured by CT scanning with errors of 3% or less [24] However, studies to date have measured total kidney volume, which includes tissue that does not contribute to renal function. The justification that the male has greater kidney volume than female is that The occurrence of larger glomeruli in men is solely dependent on their greater body surface area than females [25]. The effect of gender on renal character may be due to a direct action of sex steroids on kidney growth or is secondary to differences in body composition, or other factors [26]. Measuring body mass index has shown enhanced correlation with adult renal volume (p=0.007,0.009) for right and left renal volume than body surface area (p=0.207,209). This agreed with the study done in children and adults [26] Right and Left kidney volume correlates more strongly with body size than with age (p=.544, .575 ) this also consigned to the study findings done in children [26] This, together with the fact that BSA are closely linked in adults, suggests that renal enlargement during development is an adaptation to body size and that this continues into adulthood. [27] Renal length determination is common in everyday radiology practice. However, a normal range of kidney sizes may not apply to people of all body habitus. This study investigates this relationship in order to determine normal ranges in relation to body habitus Left kidney length=0.038height+3.940 R 2 =0.128 Right kidney length=0.028height+5.202 R 2 =0.073 Kidney lengths were measured the patients had normal serum creatinine levels, ceratinen clearance with no history of renal disease, no renal masses, and normal-appearing kidneys on MR T 1 weighted images. The patients information were recorded. The mean renal length was 10.18±0.46, 10.67±0.47 for Right and left kidneys respectively .Males have mean length 10.23±0.49 and 10.7±0.46 and females have mean kidneys length =10.14±0.44, 10.6±0.5 for Right and left kidney length correspondingly. Statistical analysis demonstrated a relationship between kidney length and body weight and height, BMI, BSA, CrCl, GFR. A significant relation was found between the kidney length and body height. Additionally, kidneys lengths were generally larger in males than females, that means normal renal length varies according to patients' body habitus. This variation can be expressed as a function of body height, which can be represented by an equation and used as an easy reference in clinical practice.
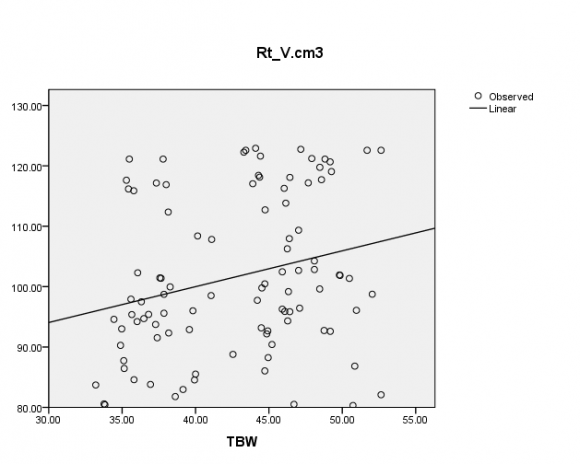
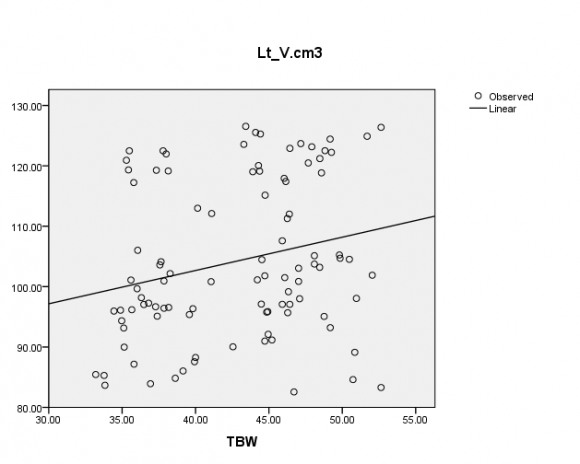
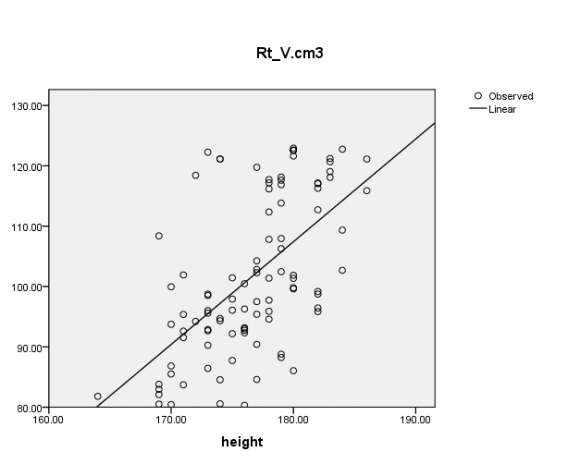
Both kidney volumes and kidney lengths were significantly correlated to body indices (BMI, height, TBW) at p value=0.013, 0.021 for TBW with RT and left kidney volume and 0.007,0.009 the BMI with RT and left volume,0.000,0.000 the height with right and left volume and then0.007,0.000the height with right and left kidney length [figures 1-8] an equations were established to predict the kidneys length and volume when the Sudanese BMI,TBW, Height are well known. We also evaluated the predictability of kidney volume and kidney length to renal function, by using the CG equation which is regarded as accurate and less biased equation to estimate GFR in healthy adults [27,28] Our study showed that there was significant relation between the CrCl, GFR,serum creatinen level with weight, BSA,BMI, age TBW, gender. The result revealed that the kidney volume predicted the renal function significantly SCr 0.056, 0.007, CrCl 0.054, 0.043, GFR 0.051, 0.59 for right and left kidneys volumes whereas the kidney length did not.
The study concluded that MRI measurements using disc summation method for renal volume and length is an accurate method and the renal length and volume for Sudanese subjects were different from other population and between males and females .Renal volume can predict the renal function significantly. Body habitus has an impact in kidney length. Equations to predict Sudanese renal length and volume were built up and reference values were established.


| ? Serum Ceriatinine in Sudanese population= | ||||
| (BMI*0.031) + (age*0.003) + (Gender*-0.52). | ||||
| III. | Results | |||
| Descriptive Statistics | ||||
| Minimum Maximum Mean Std. Deviation | ||||
| Weight | 66.00 | 101.00 | 83.40 | 8.21 |
| Age | 20.00 | 45.00 | 32.38 | 6.06 |
| Body surface area(BSA) | 1.55 | 2.50 | 2.04 | 0.20 |
| Body Mass Index(BMI) | 21.10 | 34.95 | 26.81 | 3.20 |
| Height | 164.00 | 186.00 | 176.0 | 4.49 |
| Total body water (TBW) | 33.20 | 52.64 | 42.76 | 5.49 |
| Serum Creatinine | 0.67 | 1.15 | 0.8 | 0.10 |
| Creatinine Clearance | 62.62 | 161.51 | 99.36 | 21.76 |
| Glomerular filtration rate(GFR) | 56.07 | 222.64 | 119.0 | 37.08 |
| Descriptive Statistics | |||||
| N | Minimum Maximum Mean | Std. Deviation | |||
| Right Kidney Volume(Cm 3 ) | 98 | 80.32 | 122.91 | 101.6 | 12.98 |
| Right Kidney Length.(Cm) | 98 | 9.00 | 11.25 | 10.18 | 0.46 |
| Left Kidney Volume (Cm 3 ) | 98 | 82.56 | 126.54 | 104.0 | 12.99 |
| Left Kidney Length(Cm) | 98 | 9.00 | 11.70 | 10.67 | 0.47 |
| Descriptive Statistics | ||||
| Minimum | Maximum | Mean | Std. Deviation | |
| RT Kidney-volume | 80.32 | 122.91 | 105.0 | 13.00 |
| RT kidney length | 9.00 | 11.25 | 10.2 | 0.48 |
| LT Kidney volume | 82.56 | 126.54 | 108.0 | 12.89 |
| LT kidney length | 9.90 | 11.70 | 10.71 | 0.46 |
| Weight | 72.00 | 101.00 | 83.45 | 7.54 |
| Age | 21.00 | 40.00 | 31.49 | 4.82 |
| Body Surface area(BSAm 2 ) | 1.79 | 2.50 | 2.07 | 0.18 |
| Total Body Water(TBW) | 34.89 | 52.64 | 46.10 | 3.70 |
| Body Mass Index(BMI) | 21.10 | 34.95 | 26.16 | 2.77 |
| Serum Creatinine | 0.69 | 1.15 | 0.85 | 0.09 |
| Creatinine Clearance | 65.61 | 161.51 | 106.0 | 20.96 |
| CG-GFR | 71.52 | 222.64 | 130.0 | 36.99 |
| Height | 169.00 | 186.00 | 178.0 | 3.92 |
| Year 2014 | |||||
| Volume XIV Issue II Version I | |||||
| D D D D ) D | |||||
| ( | |||||
| Descriptive Statistics | |||||
| Minimum Maximum Mean Std. Deviation | |||||
| RT Kidney-Volume | 80.43 | 121.12 | 96.15 | 10.84 | |
| RT Kidney Length | 9.00 | 11.25 | 10.14 | 0.44 | |
| LT Kidney Volume | 83.29 | 122.49 | 98.81 | 11.10 | |
| LT Kidney Length | 9.00 | 11.25 | 10.63 | 0.50 | |
| Weight | 66.00 | 100.00 | 83.34 | 9.08 | |
| Age | 20.00 | 45.00 | 33.53 | 7.25 | |
| Body | Surface | 1.55 | 2.43 | 2.01 | 0.21 |
| area(BSAm 2 ) | |||||
| Total | Body | 33.20 | 52.64 | 38.49 | 4.34 |
| Water(TBW) | |||||
| © 2014 Global Journals Inc. (US) | |||||